

Latest News
July 10, 2015

Editor’s Note: This article is based on research commissioned by Exa Corporation.
By Bruce Jenkins, president, Ora Research
With the unprecedented demands on today’s vehicle engineering organizations, automakers face a daunting challenge to reach their next targets for aerodynamics drag using traditional tools and methods. Trial-and-error development using wind tunnel testing achieved a coefficient of drag of 0.3. Introducing digital simulation to sequentially improve designs brought CD down to 0.24 for today’s best performing cars. But most companies have the next target set to 0.2. Without either a radical increase in time and resources — not a realistic solution for most — or else a radically more efficient and effective approach to aerodynamics engineering, this target will remain all but out of reach.
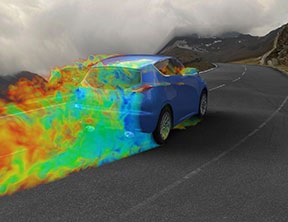
Many automotive design challenges — aerodynamics, thermal management, noise, cabin comfort and more — are heavily influenced by the complex fluid flows over and through the vehicle. The challenge faced by vehicle manufacturers in each design stage is the urgent need for information about how to improve the design. Because of its inherent advantages over physical prototype testing methods, digital simulation can bring much more feedback about design performance in each stage of development, improving the ability for designers and engineers to innovate in balancing design aesthetics with aerodynamics.
Historically the most common method of applying simulation, especially in cases involving complex flow physics or geometrical changes that are not well understood, has been to guess which combination of parameter changes will be optimal. This method is essentially based on engineers’ intuition about the most likely solution to a problem, and such an approach begins by performing one or more simulations on baseline geometry. From the results, engineers can reason about the behavior of the fluid system and thus about likely performance changes possible by changing aspects of the baseline geometry. The design department provides the extent to where and how the geometry can be changed. The engineer guesses based on intuition and previous experience as to which design parameter combinations are to be tested. This is really the only option he has. For example, if five design parameters each with five possible variants are to be evaluated, 5^5 or 3125 combinations, would need to be evaluated. There are, in practice, not enough computational resources or time available for such an activity. The problem becomes even more intractable with the increasing number of parameters and their variants. The tests provide hit-and-miss results, where the frequent misses require coming up with new guesses.
This approach relies on the seasoned experience of the engineer, and is limited to changing a few things at a time. Even then, if changes are too large or too many changes are made at once, the assumptions of impact on flow results are no longer valid, and the improvement is not achieved.
Beyond Intuition-based Engineering: Design Space Exploration and Design Optimization
Fortunately for engineering organizations, help is at hand. Fast-emerging solutions to the inefficiencies of the guessing approach are design space exploration and design optimization —terms that describe both a class of quantitative methods and a category of software tools that let engineers systematically and automatically explore very large numbers of design alternatives, and identify those with the most optimal performance parameters. For aerodynamics engineers, a new implementation of this capability is Exa Corporation’s PowerFLOW Optimization Solution, which combines statistical analysis with the ability to simulate complex fluid flow problems. Unlike the old intuition-based approach, this new approach can be used even by new engineers, and can also handle many more changes in parallel.
Exa’s PowerFLOW Optimization Solution is a fully automated optimization process that uses statistical analysis methods to systematically explore the potential of design alternatives based on results from PowerFLOW simulations. Baseline geometry is combined with a design space of shape changes to create a series of models, then the simulation results are used to create a response surface to answer various design questions. Plug-in integrations with the market-leading optimization analysis tools ESTECO modeFRONTIER and SIMULIA Isight enable easy setup and automated execution.
The PowerFLOW Optimization Solution explores large numbers of design alternatives and generates a mathematical “response surface” from a small number of simulations. Advanced algorithms then identify trends and evaluate trade-offs, providing a multidimensional analysis beyond the capability of human reasoning. Exa’s high-performance visual flow analysis tools are then used to understand and explain trends seen in the statistical analysis. From a work process standpoint, this approach fits perfectly with how an automotive design studio works with the company’s aerodynamics department: Designers provide areas that aerodynamicists can work on, then the aerodynamicists can parametrize the design space in order to search for better design solutions within the constraints provided by the designers.
Case Study: Early-stage Aerodynamic Optimization of an SUV
In a project by a leading automaker to develop a new sport utility vehicle, a key goal was to achieve a state-of-the-art drag level. To meet this aggressive target, feedback from aerodynamics had to be included in early-stage design. As the first step in the process, a detailed simulation model was built. The styling surface was combined with engine room and underbody detailed geometry from a similar-size existing vehicle. From a detailed analysis of the flow field, potential areas for improvement were identified. The aerodynamics team worked with the styling team to determine the range of design changes that would define the design space. A total of five parameters, each representing a design change to the upper-body shape in a certain range, were defined to form the design space.
In the second step, Exa’s PowerFLOW Optimization Solution was brought into play. A variant of its response surface method (RSM) involving both design of experiments (DoE) and adaptive sampling techniques was applied to characterize the effects of the design changes. The selection of an adaptive approach was made given the number of parameters was greater than five, and the timeline for the project allowed for an iterative approach. If the project were to consist of fewer parameters, an RSM approach with only a single DoE would have been used. In general, any project involving more than two simulations should become a DoE to reap the many benefits of Exa’s PowerFLOW Optimization Solution.
This characterization was followed by an optimization step to find the best possible drag improvement from these design changes. The optimum design calculated by the response surface was then validated by CFD (computational fluid dynamics) simulation. At the same time, wind tunnel tests of a fully detailed clay model of the vehicle confirmed the performance improvement predicted by the simulation results.
Critical to success of this project was how response surface models functioned as a representative or surrogate of the true response of CFD simulations. They allow interrogation methods such as analysis of trends, the main and interaction effects of parameters, and global search of optima to be performed at little or no cost once the model is built. Also, multiple response models can be built from the same input data, providing an analytical way to relate multiple objectives. This additional information extracted from the data set via the response surface model gives each individual simulation more and lasting value to the design refinement process.
Response surface methods let engineers focus on creating parameters that will have significant impact on performance while maintaining the design character of the vehicle. The software then performs the challenging tasks of finding complex trends, interactions and optima.
Response surface models take as input data from simulations in the form of independent and dependent variables. The independent variables are the design space (DS) parameters, while the dependent variables are the response space (RS) parameters. As an example, a design space could consist of geometric morphs of a car’s front fascia, rear spoiler and rear diffuser. An example of a response space could then be the car’s drag coefficient, as well as front and rear lift coefficients. The response surface model constructs a mathematical representation of a response given the matrix of design space parameters and a vector of responses for a series of simulations.
Once the response surface model is constructed, a variety of analysis techniques can be used to extract information from the data set. The first level of analysis is simply visualization of the response surface itself. This can be done by viewing the trends in one parameter direction at a time so the response surface appears as a line or in two parameter directions such that the response is a visible surface. When the response surface model has many dimensions, the one parameter or 1D visualization (Fig. 1) is useful to simultaneously view trends in many dimensions from a single location in the design space.
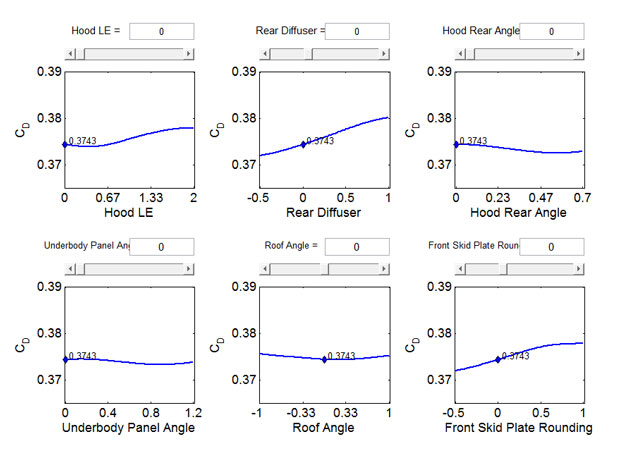 Fig. 1: 1D visualization
The two-parameter or 2D visualizations (Fig. 2) help predict interaction effects between parameters at a single location in the design space. More complex analysis of the response surface can be done by averaging parameter main effects over the entire design space to return which parameters have the largest effect on the response.
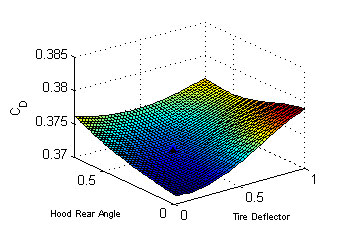 Fig. 2: 2D visualization
Finally, the response surface can be directly searched to find the predicted optimum configuration, or in the case of multiple responses, to create a predicted Pareto frontier (Fig. 3) in which the multiple response of the drag coefficient CD and the front lift coefficient CLf are plotted. In optimization problems with more than one objective, the objectives often conflict with one another, so tradeoffs must be made among them. In this case, there will be one design with the best drag coefficient, another design with the best front lift coefficient, and an infinite number of designs that are some compromise of the two. The set of tradeoff designs that cannot be improved on according to one criterion without harming another criterion is called the Pareto set, and the curve plotting drag against front lift of the best designs is termed the Pareto frontier. This search can also involve restricting the design space to let the designer explore “what-if” scenarios.
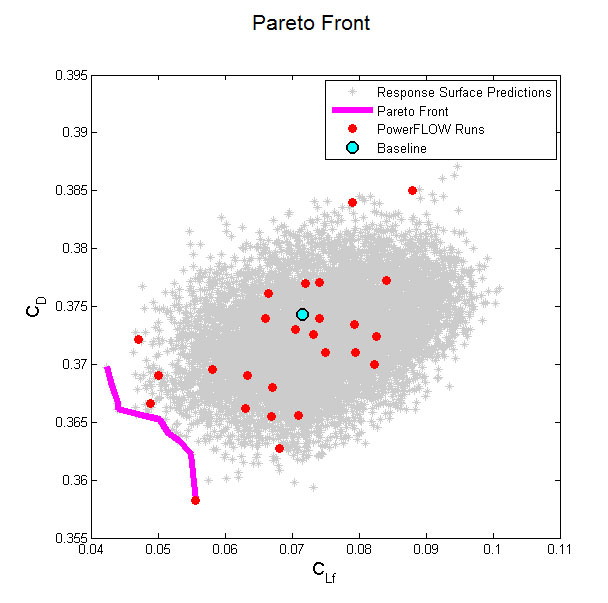 Fig. 3: Pareto Frontier
By combiningPowerFLOW accuracy with statistical methods for design, Exa’s PowerFLOW Optimization Solution allowed the project’s engineers to accurately predict real-world flow conditions without compromising geometric detail. The solution delivered accurate predictions of multiple attributes across disciplines. Resulting trends and statistics were more accurate than with conventional methods and led to a better design, while advanced morphing techniques allowed for design-quality solutions from statistical methods.
Bruce Jenkins is president of Ora Research, a research and advisory services firm focused on technology business strategy for 21st-century engineering practice.
Subscribe to our FREE magazine, FREE email newsletters or both!
Latest News


