When the Federal Environmental Regulatory Commission (FERC) asked American Electric Power (AEP) to verify the performance of the Smith Mountain Dam on the Roanoke River, near Roanoke, VA, during a probable maximum flood (PMF), AEP decided a computer simulation would save time and money. The company, which owns the dam and had to perform the tests as part of a relicensing process, contracted Alden Research Laboratory of Holden, MA, to model the flow characteristics of the dam’s spillways. It would simulate PMF, which is a theoretical event that has only the remotest possibility of occurrence. Alden used a combination of historic physical modeling results and the FLOW-3D CFD (computational fluid dynamics) program from Flow Science, Inc., to obtain its results while minimizing project costs and time spent on the project.
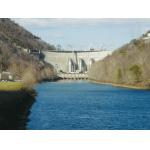
‹ ‹ The Smith Mountain Dam on the Roanoke River, near Roanoke, Virginia, was recertified by the Federal Environmental Regulatory Commission after a CFD simulation of its probable maximum flood showed its structure would hold up to flows exceeding the maximum for which it had been originally tested. .
Since the estimated flow during a PMF event greatly exceeds the dam’s original design flow, FERC was concerned that the increased flow during such an event would cause the freefalling water to overshoot the catch chute and adversely affect the base and other structures. Building a reduced-scale physical model of the dam and implementing a laboratory test would have cost about $200,000 and required some six to eight months to complete. That route was too long and expensive, so AEP decided to seek help in simulating the models.
Plugging the River Smith Mountain Dam is a double-arch concrete dam that was built across the Roanoke River in Virginia in 1966. It is 816 feet wide, 235 feet high, and 30 feet thick at the base. A total of 175,000 cubic yards of concrete went into its construction; it is part of a hydroelectric pump storage project that also includes Leesville Dam, directly below the Smith Mountain Dam. Smith Mountain Lake is approximately 40 miles long, with 500 miles of shoreline and, when full, a surface elevation of 795 feet above mean sea level (MSL). Smith Mountain Dam has two ungated overtopping spillways, each with a total clear opening of 100 feet across. A pier at the mid-span of each spillway supports the roadway across the spillway opening. The spillway crest has an elevation of 795 feet.
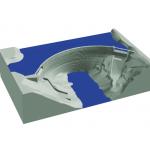 › › This overview of the Smith Mountain Dam illustrates the structure, reservoir, spillways near either end of the dam, and their corresponding catch chutes built into the steep slopes on opposite sides of the river. . › › This overview of the Smith Mountain Dam illustrates the structure, reservoir, spillways near either end of the dam, and their corresponding catch chutes built into the steep slopes on opposite sides of the river. .
Water flowing through the spillway falls through the air into a catch chute designed to minimize the force of the water’s impact where it falls. As part of a study conducted more than 45 years ago, Alden used a physical model to evaluate the dam’s original spillway design and performance at lake levels up to 812 feet above MSL. At that level, the spillways handle 50,000 cubic feet of water per second (cfs). This test data was used to determine optimum spillway geometry.
Part of the relicensing process required AEP to compute the PMF. AEP retained a consulting group that projected flows as high as 120,000 cfs with water at 821.9 feet. This exceeded the 812-foot mark for which the dam had originally been tested. AEP asked Alden to update the model by determining the flow trajectory at these higher rates.
Simulation Versus Physical Modeling Alden considered building a physical model, but its engineers felt the time required to construct and test the model would have made it difficult or impossible for AEP to meet the FERC’s deadline. To meet the schedule, Alden engineers decided to use CFD to model the dam at flood, using the data gathered during the historic physical model phase to validate the model. The CFD simulation would prove challenging, primarily because of the complexities involved in numerically modeling severely deformed free surfaces (i.e., the free flow of water through air). In this case, the water freefalls more than 100 feet before hitting the catch chute. Alden engineers revisited the photographs of the original scale-model tests of the dam and determined that the freefalling water largely remained in a coherent mass rather than breaking into clumps and droplets. This allowed Alden to disregard the effect of the air on the water, simplifying the necessary simulations. 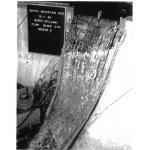
‹ ‹ This is a photo of the physical model of the dam created in 1960. It shows a hypothetical flood where the water level is 17 feet above the crest of the spillway and water is spilling from the north spillway at a rate of 50,000 cubic feet per second. This test data was used to determine optimum spillway geometry. .
Most CFD codes have the capability to model free surfaces. Typically, they require computation of both the water and air motion in order to simulate the deformation of the air-water interface. To obtain a sharp interface between the water and air, these codes require the use of very fine computational meshes and higher order numerical methods. Computing the flow in each cell over the extent of the solution domain, including air, requires significant computing resources and time.
FLOW-3D, Alden’s choice of CFD code, models only the water component of the flow, ignoring the motion of the surrounding air. When the freefalling water passes through the computational cells, the code calculates its motion. FLOW-3D eliminates cells where no water is present, reducing the time it takes to reach the desired solution. The volume of fluid (VOF) method is used to simulate free-surface fluid motion, surface tension, and other flow characteristics. The code includes algorithms that track sharp liquid interfaces through arbitrary deformations and applies accurate normal and tangential stress boundary conditions at both solid surfaces and along the air-water interface—essential in accurately modeling the dynamics of the flow associated with this project.
Building and Validating the CFD Model Alden engineers started with as-built drawings that AEP provided and created the geometry of the model using third-party CAD software. They imported the geometry as an STL file into FLOW-3D and then meshed the geometry three times: at low, medium, and high resolution. The models incorporated a total of about 13,000,000 computational cells. FLOW-3D uses a time-dependent solution scheme for all problems, including steady-state simulations.
Alden initiated the simulation for a known condition and allowed it to develop through time (spin up) to the desired flow field. The grid resolution was increased at the end of the first simulation and the results of the previous solution were used as the starting point for calculations on the refined grid. Alden’s use of multiple grids also saved time. Model runs were started on a coarse grid and graduated to successively refined grids when steady state conditions were achieved. Engineers refined the computational grid three times to obtain final results. To determine the footprint of the impact zone as accurately as possible, engineers created a submodel for each spillway using a higher grid resolution of one foot horizontally and less than 0.5 feet vertically.
Engineers assessed the simulation results by comparing the computed lake levels and flow rates with the discharge curve developed from the physical model data. The simulations predicted lake levels within 5 percent of those observed in the physical experiments for a given flow rate. Alden then generated visual representations of the spillway flow from simulation data that matched the camera angles of photographs from the physical model at each discharge condition. The physical model photographs incorporated horizontal marker lines on the catch chute to help gauge the impact zone, and Alden added corresponding lines to the visualizations of the simulated results. The analysis showed that, for equal flows, the water in the simulation was hitting the catch chute at nearly the same place as in the physical model. Furthermore, the general characteristics of the water were similar in both models. In both, the flow contracted as it left the dam and then spread out after it hit the spillway. Predicting Conditions During the PMF Once they had validated the model, Alden’s engineers changed the inlet conditions to match the PMF determined by AEP’s other consultant. They raised the inlet flow to reach a lake level of 821.9 feet above MSL, which resulted in a flow of about 120,000 cfs. At this point, the water overflowed the dam by six feet and the spillway crest by 27 feet. Alden then compared the trajectory of the previous design flow with the trajectory at the PMF. At the section shown in the figures on page 25, near the center of the spillway, the trajectory extended five to 10 feet vertically down the spillway past the impact point engineers observed at 50,000 cfs. This was still 30 vertical feet from where the change in catch chute slope begins, well within the area of the chute that was designed for the water’s impact. Engineers evaluated other sections of the dam and saw that the maximum movement in the trajectory was about 20 vertical feet and remained at least 20 feet above the bottom of the ideal landing area. Simulation Benefits Simulating the hydraulic performance of the Smith Mountain Dam provided many benefits for AEP. Beyond the wealth of technical information gained from the study, the costs associated with performing the numerical simulations were about 20 percent of the projected costs associated with the design, construction, and testing of an equivalent physical model. Further, the numerical modeling was completed in eight weeks, far less time than it would have taken to build and test an equivalent physical model.
It is important to note that the use of computer simulations was only possible because data from the original physical model was available to validate the FLOW-3D model. The computer simulations were an integral part of demonstrating the integrity of Smith Mountain Dam during the PMF. Not only did the use of computer simulations reduce modeling costs, but this partnership between AEP, Alden, and FLOW-3D represents a new frontier in the application of computational fluid dynamics.
Dan Gessler is the director of numerical modeling with Alden Research Laboratory. He’s been working on CFD for 10 years. Bernie Rasmussen is a senior engineer with American Electric Power where he has been the engineer in charge of dam safety for 10 years. Send comments about this article via e-mail by clicking here. Please reference “Before Flood, November 2005” in your message.
Product Information
Alden Research Lab
Holden, MA
American Electric Power
Columbus, OH
FLOW-3D
Flow Science Inc.
Santa Fe, NM |


;)


