Latest News
November 5, 2014
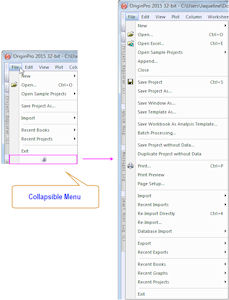 The 2015 versions of Origin and OriginPro now provide Microsoft Office style collapsible menus for some very long menus as well as context menus that display only commonly used menus. Image courtesy of Origin Corp.
OriginLab Corp. has released the 2015 versions of its Origin and OriginPro data analysis, graphing and presentation software. In total, the 2015 release has more than 100 new features compared to the previous version, including several ease-of-use enhancements from users, according to the company.
Origin provides engineers and scientists a suite of features for data analysis and publication-quality graphing. OriginPro offers all of the features of Origin with extended analysis tools for peak fitting, surface fitting, statistics, signal processing and image processing.
The Origin interface, said to be easy to use even for beginners, includes a scientific multi-sheet workbook with support for up to 90 million rows and 65527 columns per sheet. Worksheets are user-customizable and can also include floating or embedded graphs. Worksheets can support such metadata as Sparklines, which are small, embedded graphics in any context. For automating repetitive tasks, workbooks can be configured as analysis templates and custom reports. Users can also customize analysis and graphing tasks using themes, batch processing and programming.
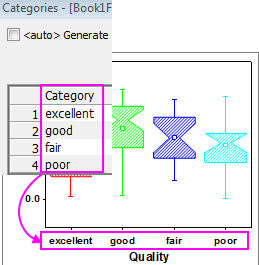 Origin Corp. says that many improvements in Origin and OriginPro 2015 provide easier and user-friendlier control options with both graphing and analysis. The image here depicts the use of categories data to control a grouped box chart. Image courtesy of Origin Corp.
Origin provides a wide assortment of data analysis, mathematics and data manipulation tools including peak analysis, curve fitting, statistics and signal processing. It supports many common formats for importing data, such as Excel, NI Diadem and MATLAB. Origin is also an Automation Server for users of VB, C++, C# and NI LabVIEW. Results can be exported in a variety of formats. An integrated Project Explorer helps users organize their Origin projects.
Origin comes with more than 100 built-in graph types. It supports contour, 2D and 3D graph types as well as specialty graphs such as windrose, stock (OHLC), ternary including ternary-contour, 2D and 3D vector and several statistical plots, including histograms, kernel density, Pareto, probability and Q-Q plots. Origin includes two built-in programming languages: Origin C, a C-based compiled language, and a scripting language called LabTalk. The 2015 release adds new support for the Python scripting language.
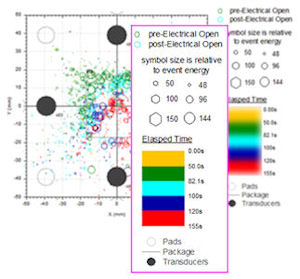 The axis dialog has been improved in Origin and OriginPro 2015. Image courtesy of Origin Corp.
Key enhancements in Origin 2015, reports the company, include collapsible menus, project file search for string, thumbnail previews of graphs and tooltips displaying folder or window comments in Project Explorer, choice of icon- or details-listing of project contents, a redesigned graph axis dialog and an improved graph legend with support for bubble scales. Users also now have access to 3D batch plotting, user-defined ordering of categorical data and repeated measures ANOVA with unbalanced data. New graphs types include heat mapping and 2D kernel density plots.
Origin 2015 introduces a Microsoft Office style collapsible menu for some very long menus, as well as context menus, so only commonly-used menus show by default. The 2015 version of Origin Project Explorer has been improved with a new find and search functionality that enables users to locate a string anywhere in a project. Other Project Explorer enhancements include the ability to view extra large icons for previewing multiple graphs simultaneously. New analysis and statistics functionality includes repeated measure ANOVA tools that support unequal sample sizes.
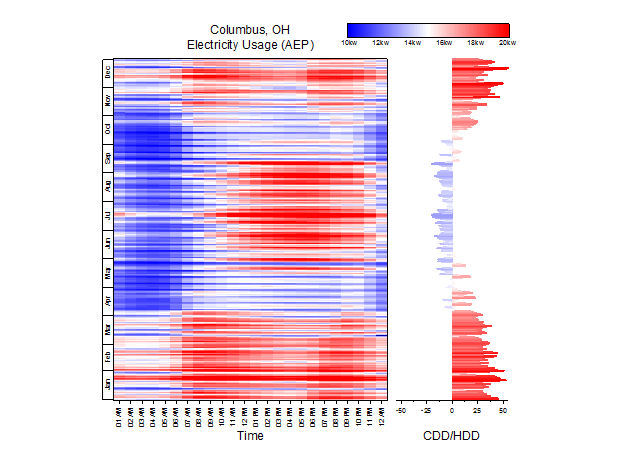 New graph types in Origin and OriginPro 2015 include column scatter, kernel density plot, custom percentile and jitter points in box chart and, pictured here, heat map. Image courtesy of Origin Corp.
The 2015 version of OriginPro has been enhanced with a new Distribution Fit functionality to fit a parametric distribution to data. Additionally, new T-test on Rows functionality that can help users examine the distribution of data and estimate parameters for a distribution debuts in OriginPro 2015.
Origin and OriginPro 2015 run on Windows 7, 8, XP and Vista systems. Workstations require a 1.5GHz or higher Pentium-compatible processor, 1GB of RAM, a DVD drive (if installing from DVD) and 2GB of free hard disk space. Mac users can run Origin by using Microsoft Windows via Boot Camp or within OS X using third-party virtual machine software. Single-user pricing begins at $1095 for Origin and $1800 for OriginPro. Origin software is also available in OEM (original equipment manufacturer), student and multi-user packages.
To learn more about the 2015 versions of Origin and OriginPro, visit OriginLab.
Watch a video on the key new features in Origin and OriginPro 2015.
Click here for key new 2015 features by version.
Click here for a features comparison of Origin and OriginPro.
Download a complete list of all the features in Origin and OriginPro 2015.
Sign up for a demo version of Origin or OriginPro.
See why DE’s Editors selected Origin and OriginPro 2015 as their Pick of the Week.
Sources: Press materials received from the company and additional information gleaned from the company’s website.
Subscribe to our FREE magazine, FREE email newsletters or both!
Latest News
About the Author
Anthony J. Lockwood is Digital Engineering’s founding editor. He is now retired. Contact him via [email protected].
Follow DE

