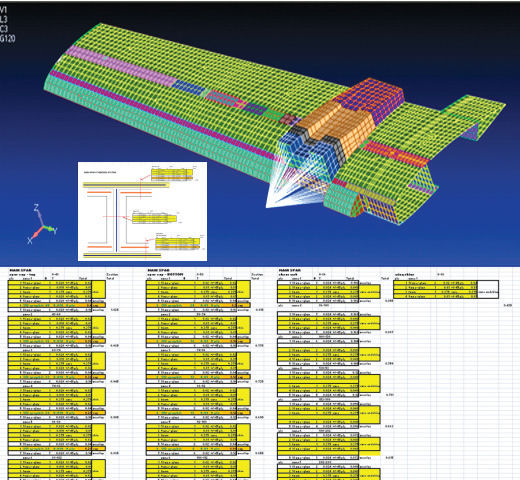
Fig. 7: Laminates in a complex structure.


Latest News
October 1, 2014
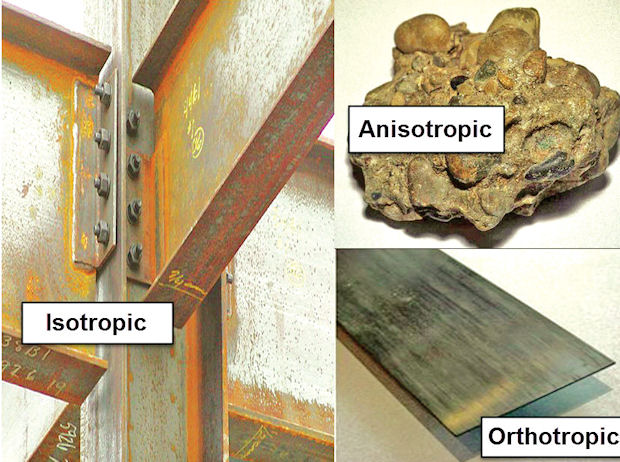 Fig. 1: Material types.
Editor’s Note: Tony Abbey teaches live NAFEMS FEA classes in the US, Europe and Asia. He also teaches NAFEMS e-learning classes globally. Contact [email protected] for details.
Throughout industry, many designs use composite structures or components for increased structural strength and stiffness-to-weight ratios, simpler manufacturing processes or more innovative design capabilities.
The nature of the composite system used can range from cheap and freely available glass fiber reinforced systems to exotic and specifically tailored carbon, Kevlar or even metal/matrix systems. Many forms of manufacturing process are available. The design variations available within composites are immense; ply thickness, orientation and property can all be varied to tune the structural response.
Designs may include thick composite sections with large numbers of plies and regions of significant ply drop-off. The shape of the structure may imply changes in draping angle or layup thickness, and it may be important to model this accurately. Tee joints may be loaded in tension, and through-thickness effects then become very important for strength prediction. There are potentially large amounts of stress or strain data from a multi-ply layup structure—and many failure theories to assess strength.
Decisions are needed on the type of idealization, level of detail required and definition of failure. A rational approach is needed to use the finite element analysis (FEA) results to design and verify the structure.
Material Types
Materials usually fall into one of three categories, as Fig. 1 shows:
• Isotropic. The same material properties occur in all directions. Steel is a typical example.
• Anisotropic. Different material properties occur in all directions. A chunk of volcanic rock is a typical example.
• 3D Orthotropic. A special case of anisotropy, with distinct material directionality in three directions. Composite systems fall into this category.
In a carbon fiber and resin system, for example, the “along-the-fiber” (longitudinal) axis, “transverse-to-fiber” (transverse) axis and “through-fiber-thickness” (through) axes are different. In thick sections, edges, joints etc., through thickness and edge effects can dominate—giving a 3D stress state needing 3D solids or thick shells in FEA idealization.
2D Orthotropic is a further simplification where the through thickness axis direction is ignored. This is the usual starting point for what we call Classical Laminate Theory (CLT), the foundation of most FE solutions. Thin shells are used for this type of idealization.
The Composite System
A composite is a system that consists of fibers in a resin or similar medium (called the matrix). The composite is usually shown in a macro-level schematic, as in Fig. 2. In reality, of course, the fibers are very small in diameter and scattered through the matrix, and interaction is much more subtle.
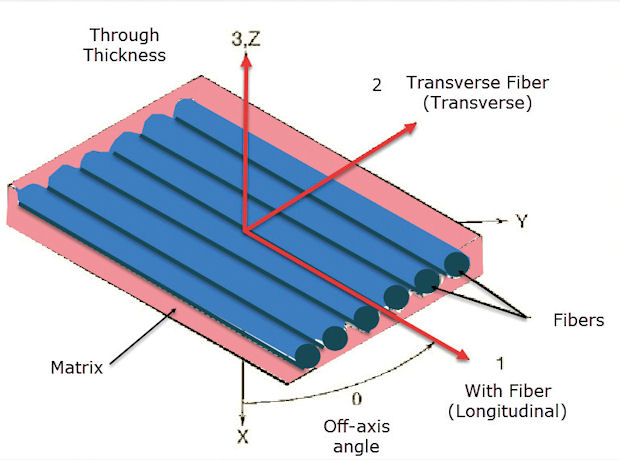 Fig. 2: Fiber and matrix schematic.
The fibers in isolation can have incredibly strong and stiff properties, but it is important to consider both the fibers and the matrix as a system at micro-level to assess the material stiffness and strength. Fibers will have microscopic dislocation, cracking or kinks and not be perfectly aligned—the weaker matrix forms a stabilizer. Fig. 3 shows the strengths achieved in testing for the different loading directions: X is longitudinal; Y is transverse. Notice tension (Xt, Yt) and compression (Xc, Yc) are different.
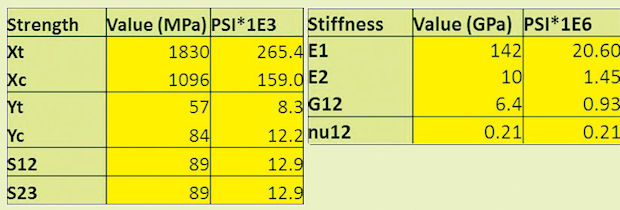 Fig. 3: Typical material properties.
A pre-impregnated sheet (pre-preg) has well-defined fiber and transverse fiber properties; through thickness effects for thin skin type structures can often be ignored. Sheets can be laid up individually forming a ply, or overlaid in a stack called a laminate (or layup or stackup). If loading is applied in the fiber direction for a single ply, high full strength can be achieved. In practice, though, loading is usually “off-axis” and strength is drastically reduced—as shown in an FEA result in Fig. 4. A range of loading angles from longitudinal to transverse are applied to a single-ply.
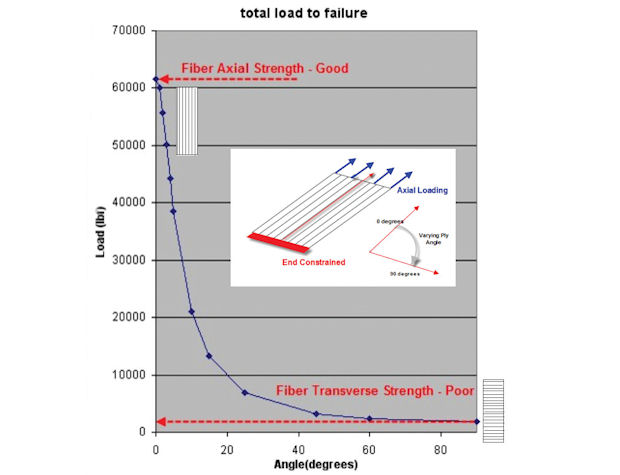 Fig. 4: Single ply off axis strength.
With load in the transverse direction in tension, the matrix forms the weak link and will fail. For other loading angles, the interaction among longitudinal, transverse and shear strengths becomes more complex. The ply stress state has to be calculated, and then effective strength assessed. This requires a failure criterion that includes longitudinal, transverse, shear and interaction terms. The most popular failure criterion is probably Tsai-Wu, which was used here to predict failing load in the single ply.
Laminates
In practice, plies are rarely used individually; multiple plies are stacked in a laminate to tailor the performance of the composite. Plies can also be woven cloth, which will have aggregate properties very different from unidirectional. In FEA usage, though, it is still considered a single ply. A laminate can have plies of both unidirectional and woven material.
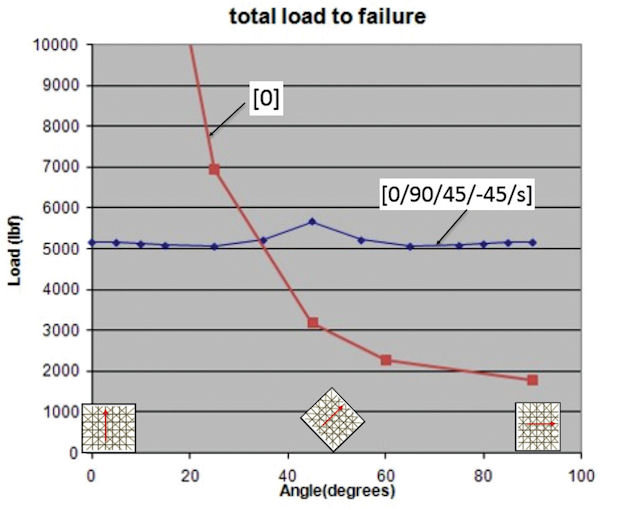 Fig. 5: Off axis strength, single ply and pseudo isotropic laminate.
Tuning the material, layup orientation, thickness and stacking order is key to optimum design. There are many more variables available than in an isotropic material. A classic example is in a pressure vessel, where the ratio of hoop-to-axial stresses is 2:1. In a steel vessel, we just have to accept the overdesign in the axial direction (all similar structures, from pipes to sausages, always split along their length). However, with a composite, we can tune the strength in the axial and hoop directions to match, giving a much more efficient structure. Composite pressure vessels are very common.
The shorthand used to describe plies in a laminate is angle1/angle2/angle3/etc. Extensions to this are:
• [0/90/45/-45/s] indicates a symmetric layup: [0/90/45/-45/-45/45/90/0]
• [0/90/45/-45s] (or over bar) indicates a symmetric layup through the last ply center surface: [0/90/45/-45/45/90/0]
• [0/90/45/-45/as] indicates an asymmetric layup: [0/90/45/-45/45/-45/0/90]
• [45/-45]6 indicates a repeat of 45/-45 six times in a layup : [45/-45/ 45/-45/ 45/-45/ 45/-45/ 45/-45/ 45/-45/]
Compound definitions are used such as: [[0/90]4/[55/-55]3]s
A fabric or woven material is sometimes shown as (30/60) or (0/90) or (+45/-45) or (+-45)
Mixed materials may be defined as (a) and (b): [45(a)/-45(a)/0(b)]s
If the single ply is replaced by a [0/90/45/-45/s] laminate of the same total thickness, the maximum strength is reduced, as shown in Fig. 5. However, the strength at any loading angle is now predictable. This type of configuration represents a type of pseudo isotropic material. It is a conservative design, as opposed to special laminates tailored for more extreme loading cases.
In the November issue of DE, we will discuss how to calculate the laminate stiffness and strength terms that allow prediction of this behavior.
Failure Prediction
The simplest approach to FEA failure is to assume that as soon as a composite strength value is exceeded by the stress level present in any ply, the structure has failed, or at least is not fit for further service. This approach is called First Ply Failure mode. In November, we will review more advanced failure modeling.
The Tsai-Wu failure criterion was mentioned earlier, and is similar in concept to the Von Mises criterion for isotropic material. However, multiple directional failure modes must now be included. Important features include:
• directional material strengths (longitudinal, transverse, shear);
• tensile/compressive distinction; and
• directional stress interactions.
Criteria such as Tsai-Wu fit a continuous failure curve, as shown in Fig. 6. A Failure Index (FI) of 1.0 indicates the ply has just failed. Greater than 1.0 is bad news, and less than 1.0 is safe. No completely reliable failure theory has emerged, and specific material testing data is required in safety critical cases. More advanced criteria based on individual failure modes, rather than a continuous curve fit, is a topic for another day.
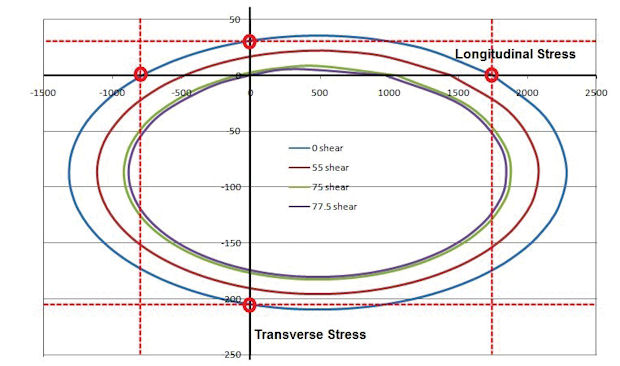 Fig. 6: Tsai-Wu failure envelope for various shear stress states.
It is not possible to scale a design by using the FI directly, as it is a quadratic term. Most solvers give the option to convert the FI to an alternative linear form called the Strength Ratio (SR). This can be used directly to resize designs and assess safety margins.
Practical Considerations
Thin shell element models use CLT to idealize 2D orthotropic materials where through thickness effects are ignored. This works well for thin skins, webs and flanges, but is not suitable for thick sections, joints, edges or any other case where through thickness effects are important. In these cases we need a full 3D orthotropic representation. This is done via solid 3D elements or special thick shell elements.
Two stress systems often dominate in 3D scenarios: direct through thickness stress and interlaminar shear stress. Both cause ply delamination and peeling, as well as matrix cracking. It is important to assess whether a component should be represented by a 3D solid, as the 2D shells will completely miss the 3D effects and give incorrect results.
The definition of a composite element property requires the laminate present at that spot on the structure. With a complex structure, such as in Fig. 7, it can become tedious (and error-prone) to map overlays of plies. The strategy for tracking this data needs to be planned well in advance, either using a spreadsheet as here, or more specialized tools that mimic the “natural” process of laying up plies over a structure and building laminates.
 Fig. 7: Laminates in a complex structure.
If a structure has significant curvature, particularly of conical form, ply draping may be important. Consider trying to drape a glass-reinforced plastic (GRP, or Fiberglass) cloth over a dome shape. It will scrunch up as we go around the dome, and we will have to cut darts to achieve a smooth drape. The resultant flat ply pattern will be complex, and the drape angles will change over the dome surface. In an FEA model it may be important to capture these effects, and software is available to predict this.
However, it is vital that the analyst, designer and production engineer all work together to ensure the as-designed, the as-built and the analyzed structure are one and the same! These tools are very powerful, and should be used across disciplines to avoid analyzing a totally unrepresentative model.
Assessing Results
The quantity of data from a composite FEA can be immense. Each ply will have three directional stresses, with failure criteria, and there will be many plies in a laminate. The structure may have many different layups across regions. Various stress sorting and filtering schemes are available in the solver and post processor. Become familiar with these tools, as you’ll spend far more time assessing local behavior than in isotropic materials. The use of contour plots and specific ply mapping tools is essential.
One logical approach to assessing strength results in thin shell structures would be as follows:
1. Plot overall SR as a contour plot (this is preferable to FI, as it scales linearly). Use this to assess where the “hot spots” are in a structure.
2. Identify the hot spots, and put the elements in these zones into separate groups for visualization.
3. For each zone, identify which ply is most critical in the laminate (that is, what triggered the critical SR). This is usually available as a direct output quantity. If it is not, you will have to create a filtering method or a macro to find it—it is a critical step.
4. Having identified the critical ply, the component stresses are plotted in turn to understand the driving failure mechanism (fiber tensile failure, matrix transverse or shear failure, etc.). Based on that information, evaluate possible design changes.
5. Another option is to assess the local hot spot laminate results in detail and conduct “what if” scenarios to understand design changes. Third-party ply stress calculators are available, or contact the author for a simple free educational spreadsheet tool.
The use of composite brings many advantages to the designer. However, with this comes increased complexity. There may be poor evidence of test data for specific composite materials under compressive and shear loadings in particular. In this case, failure theories need to be used conservatively.
More input data, more analysis and more output data all translate into taking a logical approach toward model construction and results interpretation. This has to be planned in advance, and will require developing strong skills in the tools required.
Next month, we will delve into the theory behind composites a little more deeply, and explore some of the most recent innovations in FEA methods.
Subscribe to our FREE magazine, FREE email newsletters or both!
Latest News
About the Author
Tony Abbey is a consultant analyst with his own company, FETraining. He also works as training manager for NAFEMS, responsible for developing and implementing training classes, including e-learning classes. Send e-mail about this article to [email protected].
Follow DE

