From IDL to Mathcad, and Maple to MATLAB & NAG, Numerics Dig Deep
Five powerful numerical analysis packages that enable you to quickly analyze data or explore the extreme with custom code.


Latest News
November 1, 2009
By Pamela J. Waterman
Numerical analysis tools would have helped when I was in grad school. Just a little too late for me, the mid-’80s saw a tumble of development efforts for software packages that could handle the detailed data generated across every field of science and engineering. Whether images from the Mars Mariner missions, CAT scans, sensor data from automotive crash testing, or stress values from mechanical simulations, raw data mushroomed and we scrambled to release its deepest meaning.
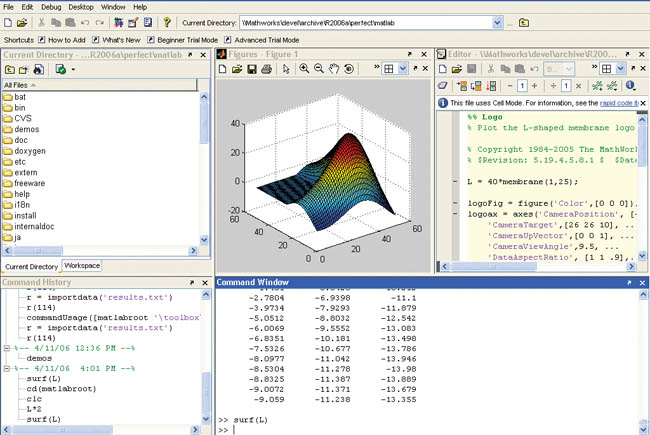 The MATLAB development environment, now with support for Windows XP Professional x64 Edition, lets users interactively analyze and visualize data, develop algorithms, and manage projects. Image courtesy of The MathWorks, Inc. |
The rise of PCs, workstations, and mainframes spread numerical analysis from its high-end roots in academia and proprietary industry enclaves to the desktops and eventually laptops of every-day users. Now, whether you crave the ability to clean up, analyze, and interpolate reams of acquired or simulated data, “write” and solve integrals in a snap, benefit from automatic unit conversion, or compose scripts that guide other users through standard procedures, you’ll find onscreen power like never before.
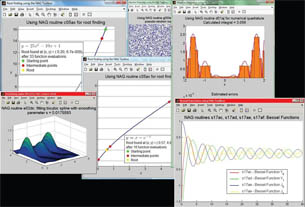 Design engineers seeking a broad range of mathematical and statistical functionality important to rapid product prototyping without the considerable expense and bother of sourcing multiple MATLAB toolboxes, can now access 1,415 rigorously tested numerical routines in the Mark 22 Release of the multipurpose NAG Toolbox for MATLAB. Image courtesy NAG |
DE takes a top-level look at a number of intensely capable packages, their origins and their options. Seasoned users will get a peek at just-released news, too.
Some Numerical Considerations
For many engineers and scientists, Excel is the new graph-paper/slide-rule/graphing calculator (choose one or all). Indeed, this simple looking spreadsheet program hides pretty deep capabilities for performing such numerical tasks as writing formulas, finding means or graphing. Got lots of data? Excel 2007 supports spreadsheets up to 1 million rows by 16,000 columns and operates on multicore processor platforms.
But many people also use Excel as just the first step in much larger calculation jobs, feeding data to downstream software that has the power and flexibility to analyze, interpolate, plot, and visualize millions of data points and help users devise new algorithms for further analysis across innumerable (no pun intended) application areas.
This article highlights five packages that tackle some or all of these tasks: IDL 7.1, Maple 13, Mathcad, MATLAB, and Numerical Algorithms Group (NAG) Toolbox for MATLAB. You might find similar or complementary capabilities in Mathematica, Origin8, Tecplot and LabView software. Stay tuned to DE to learn more about the latter group in a follow-on piece.
Whiteboards, Natural Math, Unit Conversions
Mathcad (from PTC’s 2006 Mathsoft acquisition) seems like a vast intelligent whiteboard on your computer screen. It performs analytical and engineering calculations by letting users build mathematical formulas (both numeric and symbolic) and add documentation just as if they were doing it by hand—but better. (Click-and-drag integrals are awesome!)
Mathcad Director of Product Management Mark Walker points out that some of what sets Mathcad apart from other analytical and engineering calculation software packages is how flexible it is at any stage in a project. He says, “It can help whether you’re in the early stages of establishing requirements, building a conceptual idea or design, moving toward the detailed design, ]or] evaluating the design.”
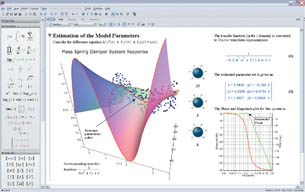 Maple 13 combines numeric computations with symbolic capabilities. Optimization functions have been enhanced and fly through animations of plotted data let users follow a path or curve of choice. Image courtesy Maplesoft |
“The way it does so,” Walker explains, “is it builds a very self-evident document of what the engineer has explored and the concepts he has put together, by combining natural ‘live’ math notation ]unlike the text-based ‘string’ equations of Excel] with live plots, images, and text; it also manages ]converts] units throughout the process.” Mathcad also has two-way integration with PTC’s Pro/ENGINEER and Windchill products.
Extensive online engineering handbooks for civil, electrical, and mechanical applications let Mathcad users open and import formulas that are immediately “live” for entering sample data, getting instant numerical values, and clicking to plot the results. The company’s next release will support design of experiments, manage the order of operations on the fly as users make changes, and improve the user interface, aiming at the goal of “15-minute new-user operation.”
Another ever-so-handy and powerful tool for mathematics and modeling is Maple 13 from Maplesoft. With its 1988 commercial product introduction, Maplesoft broadened its academic user base into the workaday engineering realm, moving from Fortan command lines to a Technical Document Interface.
Maplesoft’s suite of tools for engineering is designed to reduce error, shorten design time, and help users manage data, models, results, and knowledge in a single computational environment. Maple 13 combines numeric computations with symbolic capabilities. Live math lets you enter and evaluate functions as well as optimize parameters with data input from Excel, CAD files, and other packages.
New features in Maple 13 include use of faster, more robust leading-edge solvers that can handle most every type of mathematics and identify the particular solvers used along the way—a critical aspect for standards compliance and validation. Unique context-sensitive menus let you right-click and access commands particular to the information over which the mouse hovers. New fly-through animations of plotted data let you not only rotate a 3D plot, but actually follow a path or curve of your choice. And optimization functions, always a strong feature, have been enhanced in such a way that you can automatically determine many values from a 3D plot, such as global maximum and minimum.
According to Maplesoft application engineer Samir Khan, users can embed interactive components such as a knob, dial, or slider bar with code behind it, make “live” value adjustments, and see the results for a particular mathematical function. You can also plot new parameters on an existing plot and output new values, and drag a different equation onto an existing graph and plot it as well. More than 150 plot types are built in.
Extensions include Maple Portal, which offers great how-to guidance; MapleSim 2, which lets you combine electrical, mechanical, thermal, and signal-control blocks to model and simulate physical system designs; and MapleNet, a program for sharing Maplesoft interactive solutions across the Web.
Third-Party Assistance in Mastering Numerical Analysis A Web search turns up quite a few options for getting help beyond vendors’ webinars and user groups:
|
Digging into the Data
IDL (originally termed Interactive Data Language) from ITT Visual Information Solutions terms itself a “computing environment for understanding complex data through interactive visualization and analysis.” Chris Torrence, IDL product development manager, says no programming experience is necessary for putting together the basic scripts that read in data or produce numbers or plots. He adds, “The language is simple. You can stay at this level or build programs for other users, including widgets and buttons.”
What differentiates IDL 7.1 is its ability to help users create tools that offer command and control over how one analyzes complex data. The latest version of the software, based since 2007 on the open-source Eclipse code, now boasts a “modern” environment via the IDL Workbench. It features drag-and-drop tools for data management, allows opening many file types without writing code; operates cross-platform in Windows, Mac, and Linux environments, and tracks the commands you wrote for a given operation so they can be copied and reused.
IDL 7.1 supports 64-bit architectures and multithreaded processes, and can start separate instances of IDL running simultaneously. The latter capability helps application programmers who need, for example, to ensure that the user interface is still responsive while a long Fourier transform is running in the background.
MATLAB from The MathWorks has been an engineering workhorse since its debut in 1986. Offering more than 1,000 mathematical functions as well as dozens of application-specific algorithm toolboxes, MATLAB is a rich programming environment for data analysis, algorithm development, and numeric computation; with visualization as a key component of all of these tasks. The software’s technical computing applications encompass such fields as signal and image processing, data analysis and statistics, mathematical modeling, and control design, with specific toolsets ranging from aerospace to finance.
Both the name and the fundamental approach of MATLAB stem from its working with matrices. Continually building on the attributes of matrix math, Release 2009b, announced in September, includes extended support for multicore and multiprocessor systems as well as improvements for handling large data sets. But as always, users do not need to be programmers by training, and wizards and optimization suggestions serve as excellent guides.
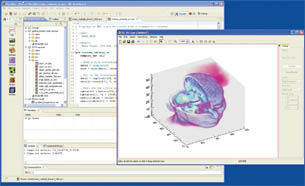 IDL Workbench view of IDL 7.1 showing an MRI stack visualized as voxels. IDL enhances data visualization with a new modern development environment including an intuitive development interface, drag and drop toolbar functionality, and advanced code-editing tools. Image courtesy ITT Visual Information Systems |
Data exploration is one of the main tasks for MATLAB. Users can easily load data from a source file such as Excel, load an algorithm that will identify a value of interest, and create plots of interest. Paul Pilotte of MATLAB points out, “There’s a level of automation here. Once you have a plot looking like you want it, you can press a button and it will automatically generate the MATLAB code” that will create that same type of plot the next time.
The resulting code is thus much more robust and tested compared to writing one’s own program in say, generic C++. Data visualization can be customized to the nth degree with functions that apply curve fitting, image processing, and comparisons of measured versus theoretical values.
You can also use the internal compiler to create programs that will run on operating systems outside of the software, even by colleagues without a copy of MATLAB. This supports the option of creating embedded MATLAB as real code for real end products. Be sure to tap into the huge online user world for beginner or expert information.
Numerical Algorithms Group (NAG) has taken a different tack in this arena, existing in a sort of parallel universe. For more than 30 years, the company has developed a family of software component libraries targeted to different programming languages or configurations that eliminate the need to write traditional code and compilers. As NAG Product Developer Mike Dewar puts it, “We deliver algorithms.”
NAG’s products for the general solution of mathematical and statistical problems work with Fortran or C, as well as such computing platform structures as symmetric multiprocessor computers or distributed memory systems. However, one of the most popular packages is the NAG Toolbox for MATLAB, now in its Mark 22 release.
Using Numerical Analysis Programs to Manage Intellectual Property No one wants to admit to getting older, but since people do retire (or, unfortunately, get down-sized), corporate knowledge in the form of engineering know-how will disappear unless companies take steps for its capture. Numerical analysis software packages can help with this task, since they reflect the thought process on a particular task or project. Today’s “whiteboard” packages can simplify the hand-off to younger engineers by presenting an intuitive, easily documented (rather then an Excel-like) interface. — PJW |
With this version, announced in September, design engineers have access to 1,415 rigorously tested numerical routines for stand-alone operation or migration into Fortran, C, and such. According to NAG, an advantage of calling their routines via MATLAB is that many arguments become optional or unnecessary, which makes code easier to read and maintain. All NAG Library routine documentation includes examples done in MATLAB code.
To get started, users just need to know MATLAB. Dewar explains that they offer such functions as meshing routines and differential equation solvers, but says it’s up to the user to put them together in the way that they need for a particular problem. Applications range from physics and engineering to finance and bioscience.
However, NAG provides extensive documentation and flow-charts for guidance. For example, if you were solving an optimization problem, it would start off by asking, do you have just one variable or many variables? And then, do you have constraints, and if you do, are they linear or nonlinear? “We try to break things down into easy decisions,” says Dewar, “and hopefully at the end of it we recommend ‘use this particular NAG routine to solve your problem.’ And then (it gives) an example of how it’s used.”
The end result is a routine you can use back in MATLAB, perhaps for working with experimental data and calling a NAG-generated curve- or surface-fitting algorithm.
More Numerical Toolbox Choices
As always, we can never cover all the possibilities in the known universe in one article. Two other well-known numerical packages that deserve a detailed look are Origin8 from OriginLab and Mathematica from Wolfram Research. Coming more from the hardware/data-acquisition side of engineering is LabView from National Instruments.
Lastly, you can find somewhat specialized numerical and visualization packages that may suit your application area, such as Tecplot software for in-depth analyses of computational fluid dynamics results. We’ll take a closer look at those packages in a forthcoming issue.
More Info:
ITT Visual Information Solutions
Numerical Algorithms Group (NAG)
Contributing Editor Pamela J. Waterman, DE’s simulation expert, is an electrical engineer and freelance technical writer based in Arizona. You can send her e-mail to [email protected].
Subscribe to our FREE magazine, FREE email newsletters or both!
Latest News
About the Author
Pamela Waterman worked as Digital Engineering’s contributing editor for two decades. Contact her via .(JavaScript must be enabled to view this email address).
Follow DE

