
CFD tests reveal how cyclists in the back aerodynamically benefit from the shelter provided by the front rider.
October 1, 2018
In 2017, videos of the Italian cyclist Michael Guerra riding his bike in the Superman pose went viral on YouTube. Guerra rode the bike in a horizontal position, with his legs fully stretched out behind him and his back facing the sky. It was the same iconic pose of the DC Comics superhero in flight. (Hence, the name “Superman pose.”) Many in the professional cycling sector wondered: Does this position offer an unfair aerodynamic advantage?
The community seemed to think one of the best people to settle this question was Professor Bert Blocken of Eindhoven University of Technology (The Netherlands) and KU Leuven (Belgium). Blocken’s previous research proved that a cyclist being followed by a vehicle could benefit from the aerodynamic push. The advantage, he revealed, was significant enough to alter the outcome of a race. (For more, read “Can a Vehicle Following a Cyclist Change the Outcome of Tour de France?,” Virtual Desktop, DE, June 29, 2015.)
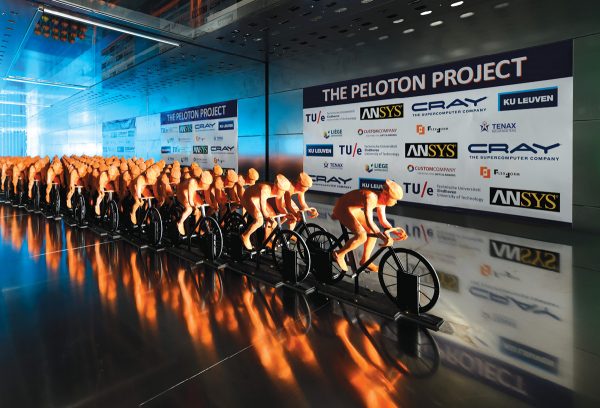 Researchers from Eindhoven University of Technology (The Netherlands) and KU Leuven (Belgium) ran wind tunnel tests on the mockup of a peloton in race. Images courtesy of Professor Bert Blocken and ANSYS.
Eventually, queries about the YouTube clip began to fill Blocken’s inbox. The Superman pose, Blocken’s computational fluid dynamics (CFD) tests proved, is indeed a highly advantageous position for drag reduction, but he called the pose “dangerous and irresponsible.”
“Professional and recreational cyclists are counter-advised to ever attempt this and the International Cycling Union should ban of this type of position by means of its rules. Cycling is already dangerous enough as it is, and cyclist safety should always be the top priority,” he wrote in a public LinkedIn response.
This year, Blocken and his team decided to examine the relative advantages offered by different positions in a cycling peloton—the platoon or group formation. His findings confirm some things experienced cyclists instinctively knew, reveal some they may not and raise questions about the accuracy of some widely cited statistics.
Group Behavior
In an article from San Francisco-based interactive museum Exploratorium (exploratorium.edu), the museum’s senior scientist Paul Doherty wrote, “Cyclists who are part of the group can save up to 40% in energy expenditures over a cyclist who is not drafting with the group. To be effective drafting, a cyclist needs to be as close as possible to the bicycle in front of him. Many professional cyclists get within inches of the bicycle in front of them. The shorter the distance the larger the decrease in wind resistance.”
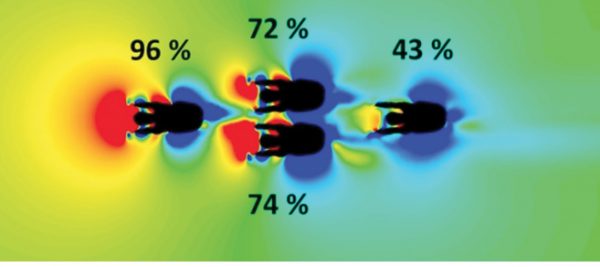
 CFD test reveals the best positions (judged in wind resistance and drag) in a peloton ride.
Because the riders in the front protect those in the back from wind resistance, riders in pelotons develop sophisticated strategies to jostle for the best aerodynamic positions within the pack in different stages of the race. Riding in the middle of the group—the belly of the peloton, as it were—offers protection from wind resistance, but this advantage is offset by the fact that riders closer to the front are in a better position to react to opportunities. Furthermore, leading riders are also less likely to be hampered by collisions.
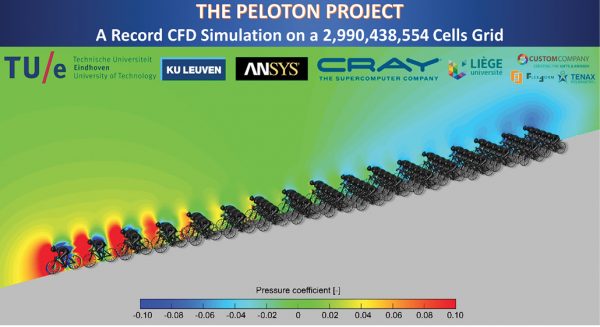
With support from simulation software developer ANSYS and supercomputer maker Cray, Blocken decided to simulate the aerodynamic interactions of a large cycling pack, involving 121 riders. It was “the largest numerical simulation ever done in the sport industry and cycling discipline,” according to the announcement from ANSYS (“The Peloton Project: Where to position leaders and sprinters? How much energy will they save?” June 20, 2018).
Blocken created a virtual peloton in 3D software and ran CFD simulations to understand how airflow, wind resistance and other factors affect the riders occupying different positions. To verify his findings, he also ran wind tunnel tests on a physical mockup, comprising 121 quarter-scale Neolith sculptures of cyclists.
According to his findings, the best position is in the core of the peloton close to its head, rows 12 to 14. His model also revealed, according to Blocken, “the drag experienced by the athletes in this position is 10 to 20 times less than for an isolated cyclist.” Reactions from the cycling research community are 98% positive, Blocken estimated. The remaining 2% falls into the extreme spectrums, from “this is nothing new; we knew this already,” to “we do not believe these results,” Blocken reveals.
Surprises
Some of the common beliefs about drag reduction in peloton rides can be traced back to “old tests in wind tunnels with up to four riders in line, where it was noticed that riders 3 and 4 have about 50% of the resistance of a lone rider,” Blocken explained. He believes extrapolating these numbers to the subsequent rows (fifth, sixth, seventh riders, all the way to the entire peloton) might be the origin of the suspiciously high percentages of drag reductions often cited in cycling literature.
“When you are Number 3 in a line of three or four cyclists, you are much less sheltered than when you have several rows (say, 10 or 15 rows) of tightly packed cyclists riding in front of you,” Blocken pointed out.
To get a better picture, he used a virtual peloton with 121 cyclists spread across 17 rows. His wind tunnel test was also based on the same configuration. Blocken investigated “different pelotons—a dense one and a sparse one. These peloton configurations are based on aerial photographs of actual pelotons,” he said.
Blocken noticed that key riders tend to ride at the edges of the peloton triangle. “We have now shown that these positions still have a very large air resistance, and they should move just one position more to the core,” he said.
Could cyclists experientially figure out the drag differences by riding in various positions—by feeling the wind? Would they arrive at the same conclusion shown in Blocken’s research?
 CFD tests reveal how cyclists in the back aerodynamically benefit from the shelter provided by the front rider.
Blocken is a cyclist himself, with 15 years of experience in different types of races and pelotons. He pointed out, “As a rider, it is very difficult to estimate your air resistance. You do not feel the differences between 40%, 50% or 60%. Between 100% and 60%, sure, but not in the much smaller percentage ranges.”
Number Crunching
Processing the peloton simulation means running CFD equations on a 3D model with 3 billion cells. Per peloton, it took 54 hours to run on the Cray XC-40 supercomputer. “Each node has 128GB of memory. The number of nodes utilized per job is 13,824 / 36 = 384 nodes. Total memory used is 49,152GB. Each peloton case took about 54 hours to run, a large part of which was used for writing output files,” recalled Blocken.
In a real race, peloton riders with varying heights, sizes and body types are involved, but to account for all these differences in the CFD model or the wind tunnel test would have been impractical. “There is an infinite number of possible combinations of cyclist sizes and distances in between, but evidently we cannot do an infinite number of simulations and an infinite number of wind tunnel tests,” said Blocken.
Therefore, there remains a wide range of possible research to follow his initial findings. Blocken reasoned, “We did not investigate cross wind. That is for a follow-up study ... We did not consider cross-wind situations and pelotons going through bends in the road, as then the peloton can have a very different configuration. That is for follow-up research in the coming year.”
Winning Strategy
Conventional wisdom suggests that, in a peloton race, you can take shelter from the wind by riding behind other riders, then breaking out at the critical moment to overtake the competition. Blocken’s findings may give cyclists new ways to refine this basic strategy.
“For the first time, we provided a digital map of what positions have what air resistance. This shows that key riders should not be riding at the outer edges of the peloton anymore,” said Blocken. “Second, the mathematical models used by some teams for deciding when to attempt breakaways should be adjusted: The large number of 50%-70% air resistance needs to be decreased by about 5%-10% (or slightly more, depending on the number of bends in the race). This will lead to very different moments when the breakaway should happen.”
Thanks to aerodynamics and physics, in the belly of a peloton, even an average cyclist might feel they are keeping up with the professionals. “Though the peloton is cruising at around 54 km/h, if you’re in the belly of it, it feels like you are merely cycling at about 17 km/h. That is a very low speed that most amateurs can attain,” Blocken explained.
But a cyclist shouldn’t feel too secure in this false sense of performance. “This doesn’t mean that you and I would be able to ride along with a professional cycling peloton from start to finish,” cautioned Blocken. You could cruise along “maybe for a few kilometers, when the peloton is tightly packed and on a flat, straight road. But as soon as it goes through bends, you get this spike in the air resistance and you’ll need the skills, training, and power of a professional cyclist to be able to catch up,” he pointed out. This phenomenon demonstrates how much skill and effort it takes to successfully break away from a peloton to launch an attack or a sprint, Blocken noted.
Knowing the most advantageous aerodynamic position doesn’t automatically guarantee a victory. Other decisions—when to break out of the group for an attack, how to react when adjacent riders move in or out and how to react to the turns and obstacles on the route—still affect race performance. The athlete’s determination, skills, stamina and instincts matter just as much as the position he or she occupies in the peloton.
Blocken’s latest work with the peloton was published in the Journal of Wind Engineering and Industrial Aerodynamics, Vol. 179, August 2018, Elsevier, in Open Access: www.sciencedirect.com/science/article/pii/S0167610518303751.
More Info
“Can a vehicle following a cyclist change the outcome of Tour de France?”
Subscribe to our FREE magazine, FREE email newsletters or both!
About the Author
Kenneth Wong is Digital Engineering’s resident blogger and senior editor. Email him at [email protected] or share your thoughts on this article at digitaleng.news/facebook.
Follow DERelated Topics


