Managing Intense Numerical Analysis
Slice-it dice-it tools from NI, OriginLab, Tecplot, Visual Solutions, and Wolfram come with enough options to let you have it your way.


Latest News
March 1, 2010
By Pamela J. Waterman
A grad student I once knew went around with glazed eyes saying, “Numbers! Numbers!” when he was scrambling to interpret reams of new raw data. (Late nights and caffeine were a factor, I’m sure.) If your New Year’s resolution is to get a better handle on data management, from fitting curves to communicating results and creating batch-processing scripts, you’ve come to the right place.
 Tecplot 360 CFD visualization software calculates total vorticity magnitude and the trajectory of particles with mass, extracts vortex cores, and generates an image showing the vortical flow around the primary vortex of a delta wing at 40 degrees angle of attack. Image courtesy Tecplot |
As mentioned in a recent article (November 2009 DE), numerical software users typically fall into two categories: engineers who gather experimental data and need to process it into a more usable form, and engineers who are solving formula-based problems and need automated assistance with hand calculations. But these camps sometimes cross-pollinate and use the same tools. Here’s a look at several good options and their latest additions that just might solve your own problems with numbers.
On the Math Side
Wolfram Research delivered Version 7 of its comprehensive Mathematica package last year. This newest Wolfram development continues, as the company puts it, “a consistent focus on integrating features into ]the software’s] core functionality rather than adding them as disjointed add-ons.” For example, in addition to its ordinary differential equation/partial differential equation functions, the software now handles differentiated algebraic equations.
Mathematica’s range of capabilities helps users automatically select appropriate algorithms, track numerical precision, visualize data with interactive 3D models, and handle symbolic (e.g., XML or audio) as well as numeric data input and output. New features include intense statistical analyses, flow-line visualization (helpful for fluid and magnetic analyses), improved image processing for cases where data is only available in photographic formats, a major revamping of the graphical charting choices, and formatting options such as placing equations at an arbitrary angle.
From an operational point of view, Mathematica 7 is a high-level programming environment that supports flexible built-in distributed computing. If you’ve written code to run on two processors, you don’t have to rewrite it when more processors become available (four-processor computing comes standard). A stand-alone Workbench package serves as an integrated development environment for the company’s other products.
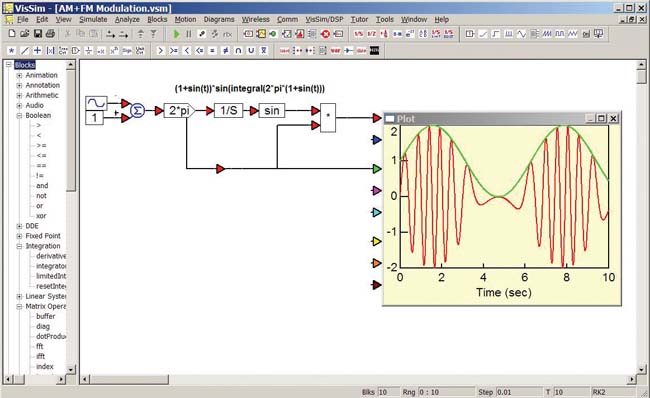
 This is a simple AM and FM modulation diagram displayed with a VisSim plot. Image courtesy Visual Solutions |
Some people compare Mathematica to PTC’s Mathcad. To help you evaluate its capabilities, Wolfram’s website offers a unique page with extensive comparisons to other software packages (wolfram.com/products/mathematica/analysis/). Organized by tasks such as Calculator Software or Simulation Systems, it’s a good place to start when prioritizing your needs.
Graphing & Visualization
Origin 8.1 software from OriginLab is another powerful package with an almost 20-year history. Version 8.0, released several years ago, introduced a complete rework of how data, graphs, and analysis results were created, explored, and organized. Now, in version 8.1, improved tasks address curve fitting, signal processing, and image processing. The software’s specialty continues to be the production of publication-quality graphics now including sparklines (small embedded high-resolution data-graphics now coming into standard use). Users can import up to 90 million data points and compare thousands of data runs, discovering underlying patterns far too subtle for hand-done comparisons.
New Origin 8.1 features include expanded customized graphing and menu options, shortcuts for accessing Windows files in the Project Explorer user interface, expanded input/export functions, an x,y data-merge function, and new productivity functions for batch processing, file sharing, and file transfer. The company’s OriginPro 8.1 adds extended analysis tools in the areas of peak fitting, surface fitting, statistics, signal processing, and image processing.
Connectivity to LabVIEW products from National Instruments is a time-saving capability of Origin 8. For example, according to user James Gardner, chief engineer at Environmental Instruments, “With Origin’s Analysis Templates it is now very simple to create a reusable application that acquires data from third-party instruments, and then passes the data for analysis and report generation to Origin. One can also get curve-fit results back into LabVIEW to display in LabVIEW’s charts and graphs on the fly. What’s best is that this is all accomplished in a native LabVIEW environment.”
Eliminate the Bookshelf Not only that, Knovel brings much of this information to life with interactive functions. You can search tables, pull out one or more data items, and export the information to an Excel spreadsheet. Live graphs mean that you can pick a point, move the cursor over it, and read off exact values. And for math that you can really use, Knovel has pulled 4,000 math examples and turned them into official Mathcad worksheets! Check out Knovel’s website to browse its list of engineers’ handbooks, materials property databases, standards, online searches, and libraries of math and best practices. The company offers online subscription plans for 23 unique subject areas (including a trial program) and recently introduced the My Knovel customizable search-content account. —PJW |
To help users get up to speed, the OriginLab website now offers dozens of multimedia tutorials on very specific tasks ranging from nonlinear curve fitting to customizing data points in a graph.
Calculation to Visualization
Where does data analysis end and visualization begin? As the lines blur between analyzing data and presenting it, users are finding that using more than one package can help them extract the most out of both their experimental and simulation results.
Tecplot’s family of products is designed to get useful information out of large amounts of complex data, and does so with visualization options in both 2D and 3D formats. The original Tecplot package focused on managing results from computational fluid dynamics (CFD) analyses, but has since split into two products. The full-function Tecplot 360 supports the CFD simulation market, while the more generalized Tecplot Focus targets any application that doesn’t need, for example, vortex extraction capabilities. A third product, Tecplot SDK, is a tool for developers to create an embedded visualization function.
The power of Tecplot 360 lies in helping users examine terabytes of data and quickly grasp the physics behind a visual 3D field representation. It displays answers to such questions as where is turbulence occurring? And is the flow attached everywhere on an aircraft wing? Tecplot President Mike Peery points out that, generally, users then want to extract numerical information, such as, How does my lift vary with angle of attack? Ultimately, he says, you want an x,y plot of some integrated quantity, perhaps versus time: “It’s not all about the glory of 3D exploration, it’s also about getting down to quantitative results.”
Users can also do feature extractions such as finding all the vortices, or showing only those surfaces where the values exceed certain limits. This capability allows specialists to explore the full 3D data field yet share relevant results with non-experts as needed.
Significantly, Tecplot’s Peery has seen a strong move toward automation for these tasks. He says, “In the past, you would simulate, postprocess, create plots, and do it all again. Now ]designers] run a thousand cases overnight, and don’t have the time to view all the plots and identify trends.” All steps can instead be fully automated with scripts and APIs, a capability not always found in the postprocessing functions of CFD analysis packages. “Scripting is the only way to make sense of it all.”
Bridging the realms of mathematics and modeling is the VisSim software family from Visual Solutions. The company describes its products as a very extensive graphical block diagram language containing hundreds of mathematical functions. Need a signal generator? Got it. Summing block? Ditto. Boolean function? Pull it down, drag it over, and “wire it” into your system with a click.
Users say that VisSim offers an easy way to create fast and accurate solutions for linear, nonlinear, continuous/discrete time and other complex, dynamic systems. Its libraries include preconstructed components such as HVAC units, gas turbines, counters, timers, logic functions, and more. Version 7 added interactive 3D plotting and 3D animation; Version 8—scheduled for release in the first quarter of 2010—features such additions as interactive knobs and gauges, named structure wires with data types, nested blocks, and block editing.
John David Hienzmann, lead engineer for motor drive development at Segway, says that when his group developed the wheel-motor drives for the Segway Human Transporter, “VisSim was a great tool for simulating control algorithm behavior, tuning loop gains, and verifying that what we built was behaving as expected.”
VisSim offers direct integration with MatLab, Mathcad, and MapleSim to make it easy to access scripts. More than a dozen add-on modules extend the main product to include additional mathematical functions and compile code in several languages.
Another tool in the spectrum between numerical analysis and visualization software is National Instruments’ (NI) LabVIEW 2009. This series of products serves as a graphical programming environment for the development of measurement, test, and control systems, with or without writing lines of code. For example, you can connect a line between a dataset and a triangle symbol (representing integration) and see the integrated results without writing any command lines.
LabVIEW’s built-in analysis functions include FFTs, curve fitting, frequency analysis (with transients), pattern matching, and edge detection. The base package also offers a single environment for combining graphical and customized textual code via its MathScript Module.
Recent performance improvements come with LabVIEW 2009’s support for 64-bit operating systems plus a parallel FOR loop function that automatically splits iterations across multiple cores. In addition, the Service Pack 1 release of the LabVIEW MathScript RT Module addresses users’ needs to deliver full determinism in situations where jitter in real-time hardware applications is unacceptable.
NI offers many add-on modules and toolkits for specific tasks such as image and signal processing and report generation. In fact, users can download fully functional trial versions of more than 25 LabVIEW applications. You can also access tutorials, sample code, webcasts, videos, and publications at NI’s extensive searchable developer zone (zone.ni.com/dzhp/app/main). Organized by technology, industry, or application area, this resource helps users quickly learn from others’ relevant work.
As always, ask questions to figure out what the software can and can’t do. The software might create 30 types of 2D or 3D graphs, but can you click on a point and extract or interpolate it? Are you comfortable with the GUI: is it easy to navigate with menus and icons, or does it require entering more code than you’d like? Does it give you the flexibility you need to create complex equations with both numeric and symbolic variables?
A great way to start is simply by viewing the software’s online tutorials and webinars, read what others are saying in forums and reviews, then run your own data through a free trial package. It’s time to tame the numbers.
More Info:
Knovel
Contributing Editor Pamela J. Waterman, DE’s simulation expert, is an electrical engineer and freelance technical writer based in Arizona. You can send her e-mail to [email protected].
Subscribe to our FREE magazine, FREE email newsletters or both!
Latest News
About the Author
Pamela Waterman worked as Digital Engineering’s contributing editor for two decades. Contact her via .(JavaScript must be enabled to view this email address).
Follow DE

