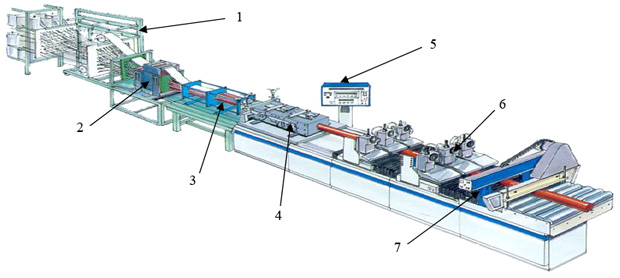
Pultrusion process: (1) creels with reinforcement, (2) resin impregnation bath, (3) folding unit, (4) forming die, (5) control panel, (6) pulling unit, (7) cutoff unit. Source: Skolkovo Institute of Science & Technology and DATADVANCE.


July 28, 2016
Structural components made of glass-fiber reinforced plastic (GFRP) fabricated into complex-profile linear shapes are widely used today in aerospace, civil infrastructure and other industries. Examples include aircraft structural components, elements of power line support structures, and bridge structural elements such as beams, decking and girders. Although somewhat more expensive than comparable components made of traditional materials such as metals, concrete or wood, polymer composite structures can have decisive advantages over their traditional counterparts, especially where weight or corrosion resistance is critical.
However, they still need to be cost-effective. One way to achieve this is by taking advantage of GFRP’s ability to be fabricated into large integral structures with lower production costs than counterparts made of traditional materials. While feasible and already applied in various industries today, this approach requires sound understanding and control of the fabrication process to avoid process-induced shape deformations. When the dimensions of finished items fall outside specified limits, misfits or clashes result when assembling components of complex structures.
The challenges of fabricating GFRP components within specified dimensional tolerances have conventionally been solved experimentally, through trial-and-error variation of process parameters during fabrication. This iterative procedure is expensive, labor-intensive and, above all, not very effective, especially when fabricating large components. Thus, industries that rely on GFRP components have an urgent need for mathematical models that effectively predict process-induced residual stresses and deformations, and reveal how to improve and optimize the fabrication process.
Pultrusion: “Pulling” + “Extrusion”
One of the most efficient processes for producing polymer composite materials with complex structural profiles is called pultrusion. A word formed from the combination of “pull” and “extrusion,” pultrusion is a continuous molding process in which reinforcing fibers are saturated with a liquid polymer resin, then pulled through a heated forming die to create the desired part. The process yields straight, constant-cross-section parts of virtually any shippable length.
In pultrusion of GFRP products, a continuous reinforcement consisting of glass fiber roving and tapes is pulled through an impregnation bath containing a thermoset resin, then fed into a heated die that shapes the pultruded profile cross-section into the required geometry and cures the resin. As the product emerges from the die and then exits the pulling unit, it is cut into sections of any desired length.
 Pultrusion process: (1) creels with reinforcement, (2) resin impregnation bath, (3) folding unit, (4) forming die, (5) control panel, (6) pulling unit, (7) cutoff unit. Source: Skolkovo Institute of Science & Technology and DATADVANCE.
Optimization and Sensitivity Analysis
In this case study, Russia’s Skolkovo Institute of Science and Technology worked with design space exploration software developer DATADVANCE to develop methods for numerical optimization and sensitivity analysis of pultrusion process parameters. The challenge was to maximize pulling speed – that is, rate of production – while minimizing the product’s tendency to deform when critical process parameters are exceeded.
The specific case studied was pultrusion of a glass-fiber reinforced C-section profile used in bridge construction. To begin, a mathematical model of material behavior was implemented using Abaqus subroutines. The model accounted for the dependence of matrix thermomechanical characteristics on the temperature and the degree of polymerization, the rate of chemical reaction of thermoset matrix polymerization, and thermal and mechanical contact with a die. Modeling methods were developed to describe a temperature field distribution, a degree of curing and a stress-strain state in the detail during the pultrusion process.
For numerical optimization and sensitivity analysis of process parameters, a simulation scheme was development in pSeven, DATADVANCE’s software platform for automation of engineering simulation and analysis, multidisciplinary optimization and data mining. The optimization parameters were initial temperature of resin, die first-zone temperature (where forming takes place), die second-zone temperature (where resin curing takes place), and pulling speed. The constraints were transverse stress in pultruded profile, maximum temperature of material, and degree of curing at the end section.
Objective functions used for the two-criteria (Pareto) optimization step were pulling speed and maximum springback at the end section. Total computing budget allocated for the problem was 80 design points. An approximation model was created and studied, and constraints were investigated. A Pareto front of optimum configurations in the two-criteria problem was obtained. Through this sequence of automated design space exploration, sensitivity analysis and Pareto optimization, the project identified a set of process parameters that allow a substantial 18% increase in pulling speed while satisfying all constraints on both the pultrusion process and the quality criteria for the finished product.
Process Simulation Methodology
Numerous phenomena had to be taken into account in order to accurately characterize the changes that occur as the preformed product passes through the heated die. These included transfer of heat into the composite material, chemical reaction of the curing process, internal release of energy during this reaction, temperature and chemical deformations within the preformed product, thermal and mechanical contact with die surfaces, and changes in thermal and mechanical properties of the composite material that result from phase transformations in the resin.
In simulating the behavior of composite materials that incorporate thermoset resins, there is a need to determine the phase state changes in the resin over time. To characterize the phase state changes, a degree of cure (changing within a range from 0 to 1) was used. The cure degree rate of change depends on temperature and on the attained degree of cure.
For stress determination, a model of transversely isotropic material was used, where the stiffness tensor depends on a phase state of resin (elastic, solid) and on changes during the cure process. The stiffness tensor at each instant of time was determined as follows: first, the Young modulus of resin was calculated using that equation; then the effective characteristics of the composite material were calculated based on a micromechanical model. Mechanical and thermal properties of the reinforcing fibers were assumed to remain constant over time.
This model was implemented in Abaqus by means of a user subroutine mechanism. Because cure processes in thermoset composite materials take place over a long period of time, their simulation was carried out using the Abaqus Standard implicit solver. Thermal conductivity equations were solved using standard Abaqus tools. The implicit two-step Euler-Cauchy method was used to integrate the cure kinetics equation.
This project focused on simulating the pultrusion process of a C-section profile with dimensions 400x120x18 mm. The profile reinforcement was built up of fiberglass rovings oriented in a longitudinal direction with the outer layer of fiberglass fabric.
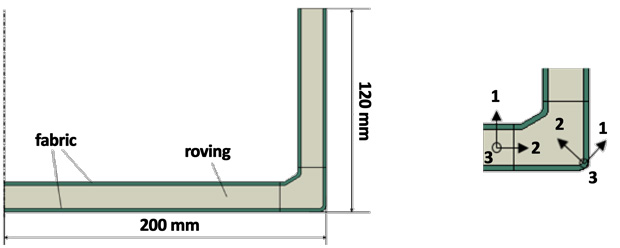 Left: half-section of C-beam with characteristic dimensions. Right: material directions in fabric and roving.
A relatively large air gap is formed between the pultruded profile and the die surfaces due to temperature deformations and chemical shrinkage. Thus, evaluation of the gap influence on stress-strain state in a pultruded profile required an additional calculation step accounting for the gap formation.
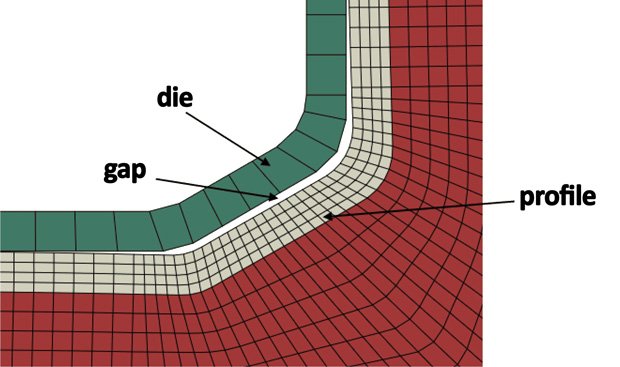 Gap formation between die surfaces and pultruded profile during heating.
Optimization and Sensitivity Analysis
The main goal in optimizing pultrusion process parameters is to maximize the pulling speed in order to achieve maximum production rate while satisfying temperature, stress, deformation and quality constraints. The constraints considered in this study were transverse stress in pultruded profile, maximum temperature of the material and minimal degree of curing at the end of the die zone. Transverse stress was measured in points with maximum values located on the inner and outer sides on the bend area. Maximum springback angle was used to control the profile deformation.
The study was performed in two steps. First a uniform design of experiment (DOE) was conducted to study the model behavior and sensitivities. Then a two-criterion optimization problem was solved to obtain a Pareto frontier showing all possible and feasible tradeoffs between pulling speed and deformation axis. A simulation workflow was created in DATADVANCE’s pSeven software to automate the study of the model.
The process parameters considered, and their bounding values, are shown in the table below:
| Parameter | Initial value | Lower bound | Upper bound | Description |
T0, C | 50 | 20 | 50 | Initial temperature of material |
T1, C | 150 | 120 | 160 | Temperature of die zone 1 |
T2, C | 190 | 150 | 190 | Temperature of die zone 2 |
U, mm/s | 1.0 | 0.75 | 1.25 | Pulling speed |
Table 1: Process parameters and bounds.
At the DOE stage, a sample of 45 points was obtained with the Latin hypercube sampling method. Sensitivity analysis was conducted on this data to estimate how variations in the model output can be attributed to variations in the model inputs.
The algorithm that was implemented provided scores for ranking features in order of their importance. This gave a rough idea of the extent to which any given feature is more or less important than the others.
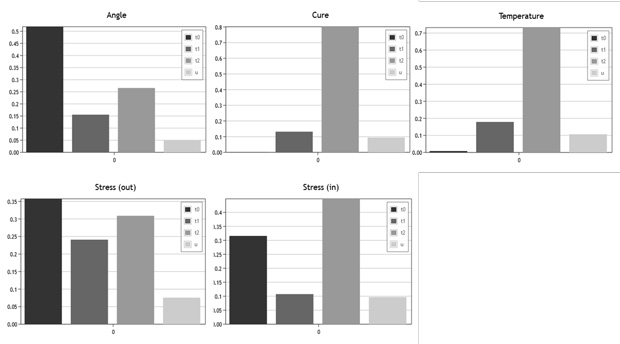 Sensitivity analysis: ranking scores.
An approximation model based on Gaussian processes was built with maximum RRMS error (based on training sample) of 0.04. Since one of the optimization goals is to reduce deformation of the pultruded part, the springback angle distribution over the parameter space was studied. The angle value (in degrees) is presented in coordinates T1 vs. T2 with ranges from the various initial temperatures and pulling speeds in Table 1.
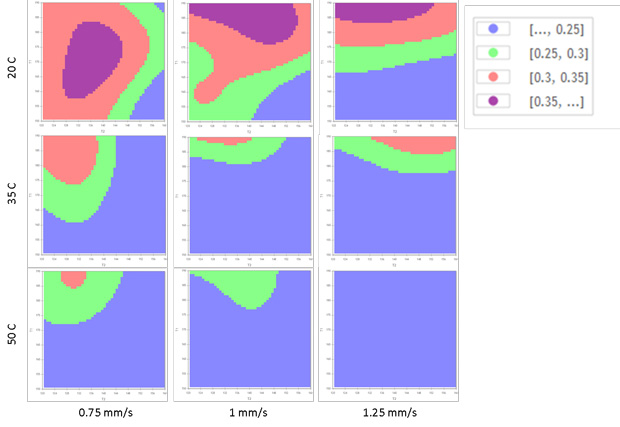 Springback angle variance.
Springback angle was shown to be only 0.5° at maximum, and less than 0.25° for almost half of all possible configurations. Increase in pulling speed does not lead to significant deformation; this finding allowed investigators to expect a flat Pareto frontier in carrying out the Pareto (multi-objective) optimization of springback angle vs. pulling speed.
The constraint values for the optimization problem are shown below:
| Constraint | Condition | Motivation |
| Tmax, C | <190 | Prevent from thermal decay |
| Cure degree | >0.95 | Provide material quality |
| Stress in, MPa | <11 | Prevent from cracking |
| Stress out, MPa | <11 | Prevent from cracking |
Table 2: Constraint values.
The approximation model allows visualization of the areas for different constraint violations. Such areas are presented in coordinates T1 vs. T2 with ranges for the different initial temperatures and pulling speeds in Table 1.
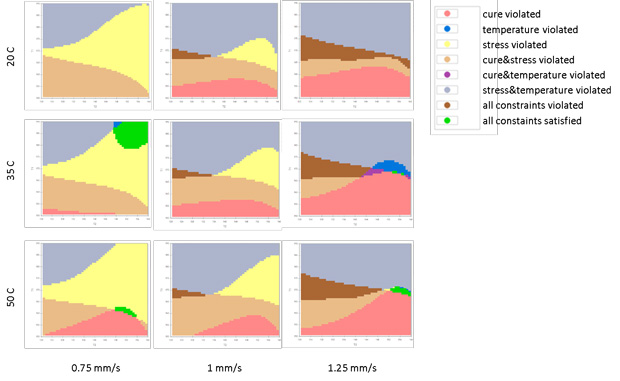 Constraint violation areas.
This study showed it is possible to obtain configurations that satisfy all constraints; however, the allowed solution area is quite small. Next, Pareto analysis was used to solve a two-criteria optimization problem: the two goals were to minimize springback angle while maximizing pulling speed. For this, pSeven’s multi-objective surrogate-based optimization (MSBO) algorithm was used. A key feature of the MSBO algorithm’s implementation in pSeven is the ability to define the computational budget (number of model evaluations allowed). Together with an initial 45 data points, only 80 evaluations were made to discover the Pareto frontier, as shown below:
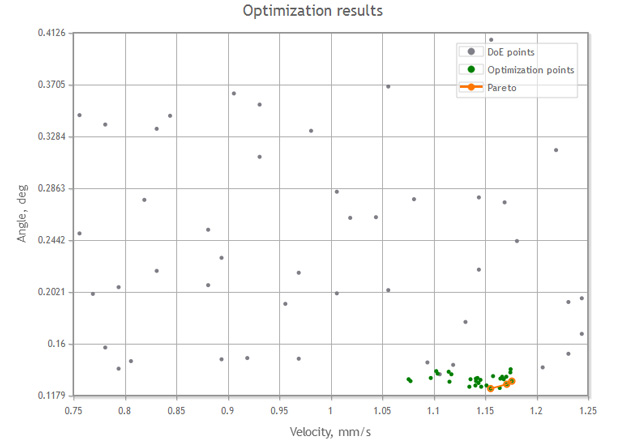 Optimization results shown as Pareto frontier.
These evaluations revealed a Pareto frontier that is almost “degenerated” with respect to the total range of values. That is to say, its dimension was shown to be less than expected: all configurations on the Pareto boundary were shown to have very small values for springback angle, so the problem effectively turned into a one-criterion optimization problem. Although that criterion—pulling speed—is limited by material stress constraints, the maximum value achieved through the optimization is still some 18% higher than the initial pulling speed.
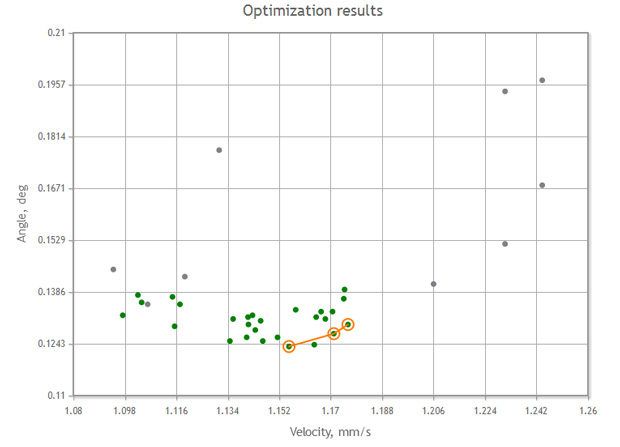 Optimization results (Pareto frontier) zoomed in.
Comparison between the initial configuration and the optimized configuration with maximum pulling speed is shown below. Parameter boundary values are highlighted in green, constraint violations in red, and constraint boundaries in blue. The comparison shows that not only was the pulling speed significantly increased, but in addition the temperature constraint is now satisfied.
| Parameters and goals | Initial configuration | Optimal configuration |
T0, C | 50 | 44 |
T1, C | 150 | 160 |
T2, C | 190 | 168 |
U, mm/s | 1 | 1.18 |
Springback angle, deg. | 0.24 | 0.13 |
Constraints | ||
Tmax, C | 195 | 189 |
Cure degree | 0.99 | 0.96 |
Stress in, MPa | 11 | 11 |
Stress out, MPa | 9 | 8 |
Table 3: Initial vs. optimal configuration.
More Information:
Research for this case study was commissioned by DATADVANCE, the developer of the software used in this case.
Subscribe to our FREE magazine, FREE email newsletters or both!
About the Author
Bruce Jenkins is president of Ora Research (oraresearch.com), a research and advisory services firm focused on technology business strategy for 21st-century engineering practice.
Follow DE

