Simulation Visualization: Seeing is Understanding


Latest News
August 1, 2017
Computer-aided simulation and analysis for engineering (CAE) has become widely used throughout industry and is no longer restricted to a few key analysts. Along with this greater usage comes a greater need to share results with a wider audience. The current trend of increased digitalization—such as internet of things (IoT) and Industry 4.0—also places new demands on the use of simulation and analysis. More than ever before, visualization is key to extending the usefulness of CAE data.
Data visualizations provide context, enabling engineering teams to find flaws or help explain complicated issues. As digital twin technology becomes commonplace, the simulation results will become as important as the geometric model for the ongoing relationship between the digital model and the physical instantiation. Simulation tools create visual results, but often these graphics are densely technical and require refinement to make their information accessible to a wider audience.
The growing complexity of simulation results and the use of simulation data further up and down the design cycle are two reasons why ANSYS recently acquired CEI (Computational Engineering International, Inc.), known for its EnSight simulation visualization software.
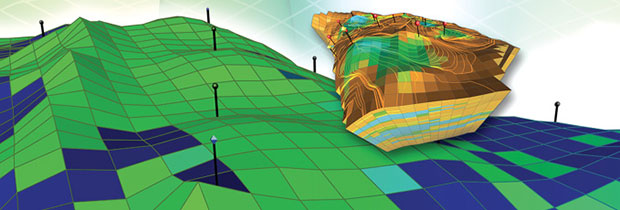
 Top: Tecplot software organizes sets of simulations and can provide data plots in three dimensions as well as visualizations that can be explored.
Bottom: Tecplot Chorus allows multiple simulations to become part of a larger study. Images courtesy of Tecplot.
“Simulation is going from what was the verification stage to more and more engineers using it upfront in the design cycle, then also further down the cycle for additive manufacturing and digital twins,” says Mark Hindsbo, ANSYS vice president and general manager. “All that data is great, but if you can’t use it effectively, what good is it?”
Understanding the Uncertainties
There are two forms of uncertainty being studied by engineering analysis, says Scott Imlay, chief technical officer of Tecplot. The first is random uncertainty, more commonly explored in scientific inquiry but also an influence in engineering. The second is deterministic, the cause-and-effect processes inherent in CAE. “If you visualize the data, you must understand the uncertainties,” says Imlay. “It is a risk-discovery process. If a simulation doesn’t tell you about risk, you have to find ways to figure it out.”
When multiple simulations are run, each with the same product specs but with changes in flow rates, speed and so on, the results need to be linked. The relationship of each CAE visualization result needs to be seen in the context of others in the set. Sometimes blank spots in the data set become obvious only when organized.
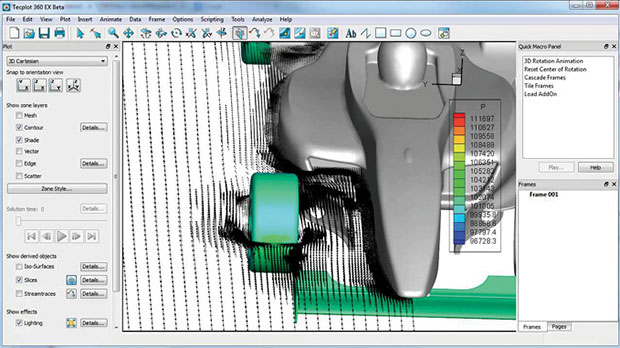
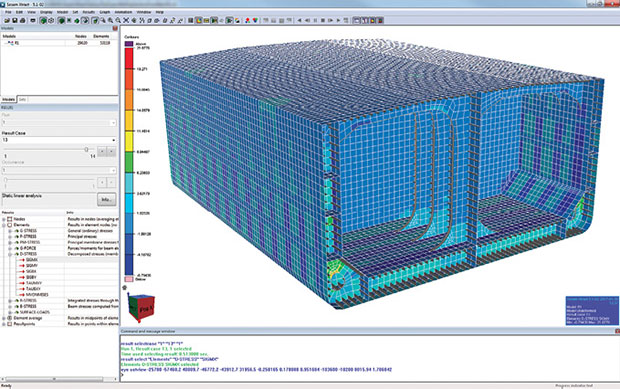 Ceetron products process large CAE sets on the server then send the results to the client using WebGL technology. Image courtesy of Ceetron.
Imlay says Tecplot Chorus is most commonly used to optimize designs, develop comprehensive long-term databases that include CAE results, predict performance over time and investigate specific engineering problems by being able to review multiple simulations as a single set.
“In all these scenarios, engineers need to discover the trends and anomalies in output variables,” says Imlay, “and to understand the underlying physics that cause these variations.”
Not a Typical Big Data Problem
Big Data is a buzzword today in enterprise IT. Most of the time, the big databases being mined by new algorithms are unstructured in nature. It becomes the job of the inquiring business intelligence software to make sense of it before it offers insights to the user. CAE data is already highly structured; the algorithms used for business investigations aren’t suitable for pass-through to engineering, thus the need for solutions specific to engineering.
Engineering data is not only different in nature from business data, but it is also inherently much larger in scale. “If you compute large amounts of data, FedEx is still the best way to transfer it,” notes Fredrik Viken, technical director at Ceetron AS, a software developer specializing in post-processing simulation data for visualization, in-depth analysis and interpretation/presentation.
“The largest engineering teams are generating thousands of simulations daily,” he says. This adds up to terabytes of data.
Most of Ceetron’s customers are vendors of CAE software, but they also sell some products directly to end users. Around 2011 Ceetron made the decision to rebuild its product line using cloud technology. A specific customer may install on a private server, but the inherent advantages of cloud technology—flexibility, infrastructure costs, location-independent access, security and reliability—are available whether using a private cloud, a service like Amazon Web Services or Microsoft Azure, or a hybrid of the two.
Ceetron applications leave the actual storage and management of CAE data to the product lifecycle management system; its products focus on the creation and use of the visualizations. Because it uses a cloud paradigm, Ceetron applications use server-side processing instead of client side, and results are rendered and presented to the client computer using WebGL. Thus the results can be viewed in any device that runs a web browser. By separating the computation of the data from the visualization, a Ceetron product like GLview Inova allows model slicing, rotation and so on at the speed of the local device processor and is not dependent on the relationship to the server.
“We are now able to simulate almost in real time the data from IoT sources, such as stresses and strains, and see the results in the web browser.” Viken says, adding that this linking of simulation to real-time performance data “will make simulation part of the lifecycle and not just design. Visualization will continue to be more important to see and understand the results and observations.” Ceetron GLview Inova works directly with most major CAE systems. It visualizes dynamic/transient results and creates time/frequency domain and mode shape animations. Once a database has been loaded, the user can rotate, zoom and translate interactively. Both image plots and 2D plots can be stored in various common formats.
More Info:
Subscribe to our FREE magazine, FREE email newsletters or both!
Latest News
About the Author
Randall S. Newton is principal analyst at Consilia Vektor, covering engineering technology. He has been part of the computer graphics industry in a variety of roles since 1985.
Follow DE

