
Latest News
October 1, 2012
By Neil Forcier, Agilent Technologies
When you are working on your bench and you need to create an arbitrary waveform, or you need to post-process measurement data, it usually means you need to write some code or buy a software package. Both these approaches can be costly and time-consuming, however, and can cause your design momentum to evaporate abruptly.
In the benchtop test environment, you often can avoid the interruption by simply combining the capabilities of Microsoft Excel with the easy data transfer capabilities found in modern test-and-measurement instruments, and free test-and-measurement software packages that are readily available. Let’s look at some common bench test situations where Excel makes an easy-to-use substitute for writing a custom program or using purchased software. Most engineers who use Excel view it as a tool for tracking parts, managing design budgets or creating plots of data for test reports. In all these cases, just the general functionality of Excel is used: organizing data in rows and columns, basic arithmetic operations and plotting. But Excel also offers built-in advanced mathematical tools, such as sine and random number functions, as well as the ability to do Fast Fourier transforms (FFTs).Creating Waveforms and Signals in Excel
Let’s start with a common situation: creating an arbitrary waveform and getting it onto an arbitrary waveform generator. For our example, let’s say we need to create a quadrature phase-shift-keyed (QPSK) signal for doing a power line communication (PLC) test. For our example PLC signal, we will use a carrier frequency of 135 KHz. The bit rate of the data is 20 Kb/s, and we want the signal to run for 15 ms. If we choose to have 250 points in each carrier frequency cycle, our waveform will consist of 506,250 points. See the equation for a QPSK signal in Figure 1.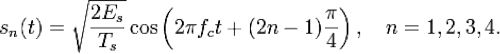 |
| Figure 1: QPSK signal equation. |
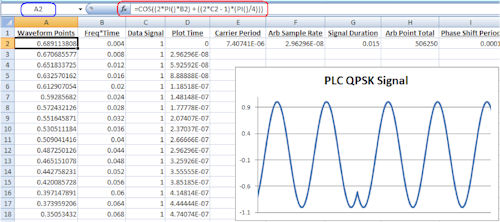 |
| Figure 2: QPSK signal in Excel. |
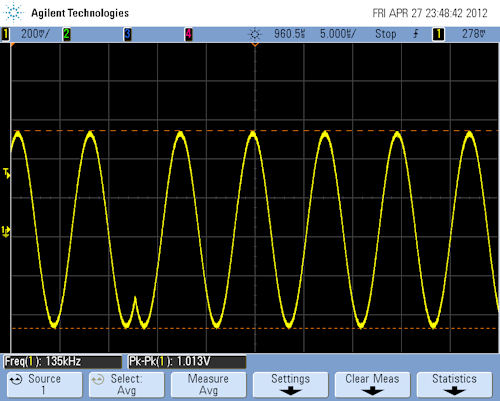 |
| Figure 3: QPSK signal created in Excel. |
Post-processing Data
Let’s look at an example of the reverse case, where we want to pull data off a measurement instrument and post-process it in some way for further analysis. For this example, we want to digitize a 60-Hz power line signal and then perform an FFT to analyze its harmonic distortion.We used an Agilent 34411A digital multimeter (DMM) for this measurement. The 34411A has a built-in low-frequency digitizer capability “and because it is a DMM, it has high resolution for detailed insight into the measured signal. We made 4,096 measurements on the power line signal at a sample rate of 10 KS/s. To get from the DMM to Excel without any code, we used the 34411A’s LXI Web interface. The built-in Web interface allows you to control and fetch readings from the instrument via a Web browser. To transfer the readings from the text field of the Web interface, we copied them and pasted them into Notepad. We then saved the Notepad file as a CSV file and opened it in Excel.To do the FFT, we used Excel’s data analysis tool set, which guides you through performing an FFT on a data set “and also includes various other engineering and statistical tools. For step-by-step instruction on performing an FFT in Excel, simply search the Web for “Excel FFT” and plenty of tutorials will show up. Figure 4 shows the captured power line signal data, with both a frequency-domain plot (using the FFT data) and a time-domain plot.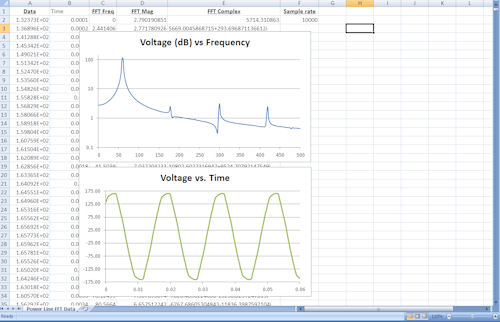 |
| Figure 4: Screen shot of Excel FFT. |
Create Test Scripts on the Cheap
Free software is available for creating test scripts or sequences in Excel that allow you to connect and control instruments without writing code. For this example, we used a free software package called Command Expert. When you download Command Expert, it creates a plug-in to Excel that allows you to easily build instrument control scripts with, of course, no programming required. Figure 5 shows a screen shot from a script created with Command Expert that connects to a signal analyzer, makes a series of frequency and power measurements based on a user-defined frequency range, and displays the resulting data.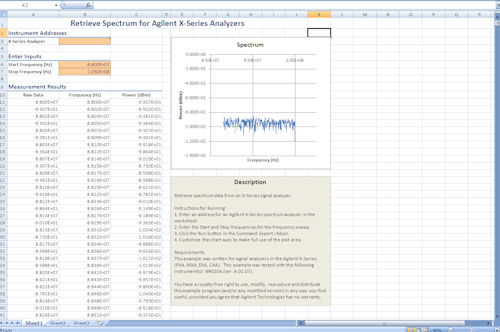 |
| Figure 5: Excel test script created with Command Expert. |
Putting it All Together
In this article, we looked at how you can combine Excel with modern instrument features and free software packages to provide an alternative to time-consuming programming and costly software. We looked at Excel’s built-in advanced mathematical and data analysis tools for processing or post-processing data that we want to push onto an instrument (in the case of the QPSK waveform), or pull from an instrument (in the case of the signal data). Modern instrument features, such as Web interfaces and USB drives, allow us to easily move data between Excel and the instrument. Finally, we looked at how free software packages, like Command Expert, can be used with Excel to create simple automated tests without writing code. While it’s not ideal for every situation, there are a number of applications in the benchtop test environment where using Excel can avoid delays.Neil Forcier served in the U.S. Navy as an electronic test equipment calibration technician on board the USS Harry S Truman CVN-75. He earned his bachelor’s degree in engineering from the Pennsylvania State University, University Park campus. He is currently working as an application engineer for the System Products Division at Agilent Technologies. Send e-mail about this article to [email protected].
More Info
Agilent MicrosoftSubscribe to our FREE magazine, FREE email newsletters or both!
Latest News
About the Author
DE’s editors contribute news and new product announcements to Digital Engineering.
Press releases may be sent to them via [email protected].


