
Latest News
July 1, 2011
By Jerry Fireman
It’s not all that difficult to design an idealized product that will perform well when each one is built exactly to nominal conditions. But variation is inevitable in everything. It’s much harder to design a real-world product that can be built in a real-world process in such a way that every unit will perform exactly like its predecessor. Will a particular combination of design parameter values cause a performance problem “or worse yet, a safety problem?
It typically costs money, often lots of money, to reduce manufacturing variability. So which design parameters should we target for reductions in variation? And how can we optimize both the nominal value and the variability of each design parameter to achieve the highest performance over the entire production volume at the lowest cost?
Design engineers have had many tools available to evaluate variation-free part performance for worst-case or nominal conditions. But they’ve had few options to evaluate the potentially infinite possibilities for how the finished products may actually turn out in mass production. Chad Johnson at TRW Automotive has been working on this problem. He has applied methods for optimizing the performance robustness and cost of designs with variation taken into account, a combination of objectives coined by Dr. Genichi Taguchi as two-step optimization.
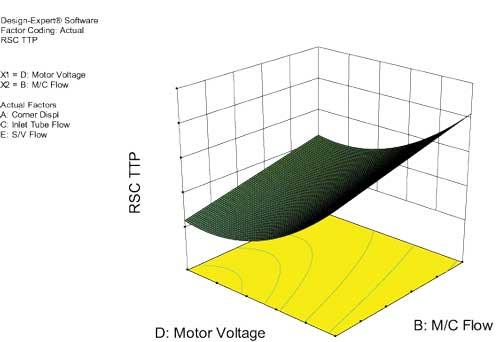
Figure 1: Time-to-pressure as a function of motor voltage and master cylinder flow.
The process begins with establishing a polynomial y=f(x) relationship to model, the relationship between the inputs and the response. The model can be acquired through a response surface methodology (RSM) design of experiments (DOE) analysis. A Monte Carlo simulation leverages that model to simulate building thousands of products. The results indicate which factors are having the greatest effect on performance variation and which are affecting the mean. The user can then change the nominal values or variability of any factor (within cost or performance constraints), and measure the impact on the performance of the entire population of products.
Under Pressure, So to Speak
For example, Johnson offers, the TRW team recently focused on a braking system where one of the objectives was to quickly generate pressure when demanded by the vehicle stability control system. The team selected the following factors as those with the greatest potential to influence the critical time-to-pressure performance variable:
- Corner displacement “the amount of fluid that needs to be moved between the pump and the brake, measured in cubic centimeters (cc).
- Master cylinder (M/C) flow rate, in cc/second.
- Inlet tube flow “the flow rate in the inlet orifice in the hydraulic line, in cc/second.
- Motor voltage, in volts.
- Solenoid valve (S/V) flow “flow rate of the solenoid valve that controls the master cylinder, in cc/second.
The first question to answer regarded the impact of these variables on the time-to-pressure. The traditional approach of building a few prototypes and measuring their performance only helps to understand a tiny fraction of the design space. One-factor-at-a-time (OFAT) experiments go further by systematically varying one factor, while holding the others constant, and recording the impact on performance. But the time required for each run makes it practical to cover only a small fraction of the design space. This approach also fails to account for multiple-factor interactions.
Applying RSM DOE
Johnson addressed these challenges by using RSM DOE to map out the complete design space while running only a relatively small number of experiments. The model was validated by measuring several vehicles under controlled conditions. DOE requires far fewer experimental iterations than the traditional OFAT approach, and makes it possible to identify the most robust combination of factors for the product. RSM provides a solid estimate for the value of responses for every possible combination of the factors by varying the values of all factors in parallel. In other words, it allows one to comprehend a multi-dimensional surface with non-linear shapes.
Johnson reaches for Stat-Ease’s Design-Expert software from his Six Sigma Master Black Belt toolbox.
“It offers a powerful, easy-to-use and statistically sound set of DOE tools behind an interface that is designed for use by an engineer, rather than a statistical expert,” he says. “Further, the Stat-Ease staffers are all excellent people, always willing to assist in any way they can.”
For the braking system project, Johnson selected a 64-run central composite design (CCD) response surface method (RSM) because it enables the user to visualize both the response values and their sensitivity to change in the factors.
Johnson’s team completed the experiment and entered the results into the software. The software then performed statistical analysis that mapped out the complete time-to-pressure design space as a function of the five factors plus second order (squared terms) and multiple interaction effects. The software fitted the following predictive model (actual coefficients omitted for proprietary reasons):
Time to Pressure =
+0
+1 * Corner Displacement
+2 * M/C Flow
- 3 * Inlet Tube Flow
- 4 * Motor Voltage
- 5 * S/V Flow
- 12 * Corner Displacement * M/C Flow
- 34 * Inlet Tube Flow * Motor Voltage
+33 * Inlet Tube Flow2
+44 * Motor Voltage2
DOE Maps Design Space
The statistical results enabled Johnson to graphically explore the design space by producing response surface maps that offer better understanding of individual factor combination effects on the response. Figure 1 maps time-to-pressure as a function of motor voltage and master cylinder flow. The map shape also indicates the non-linear effects of these two factors.
The response surface map provides all of the information needed to evaluate the performance of the design, based on any given set of values for the design parameters. It provides the ideal tool for optimizing the design parameters, as well as determining the robustness of any particular set of nominal values. But the team needed to go one step further, and simulate the performance of a large number of products built under real-world manufacturing conditions.
The Monte Carlo Simulation
Johnson used Monte Carlo simulation to accomplish this task. He defined a probability distribution for each input. Then he applied Monte Carlo techniques using the Apogee tool created by Statistical Design Institute to simulate a large production population. The technique works by randomly selecting a value for each input factor (from the earlier described polynomial) based on the assigned probability distributions. The polynomial formula calculated by Design-Expert is then leveraged to calculate the time-to-pressure (response) for each virtual product built during the simulation.
One of the most powerful aspects of the Monte Carlo simulation is the insight it provides on understanding the impact of each factor on the variability of the dependent variable.
“The combination of DOE and Monte Carlo analysis helps us understand how much impact the variation of each factor has on the overall performance of the product, while simultaneously taking into account the variation of all other involved parameters,” Johnson explains. “We can make much smarter design decisions than would be possible with either worst-case or root-sum-squares tolerancing methods. Furthermore, we can leverage the same model to optimize the design by evaluating alternatives to determine where to set the combination of parameter mean and variation to optimize the performance of every unit we make.”
Jerry Fireman, is president of Structured Information, Needham Heights, MA.
For more information:
TRW Automotive
Stat-Ease
Statistical Design Institute
Subscribe to our FREE magazine, FREE email newsletters or both!
Latest News
About the Author
DE’s editors contribute news and new product announcements to Digital Engineering.
Press releases may be sent to them via [email protected].