Helping design and engineering professionals discover, evaluate and specify technologies and processes that shorten the design cycle and enable success.
Alert!
Digital Engineering ceased publication on July 1, 2026. This website remains available as an archive of engineering content.
For inquiries or information, please email [email protected].
“This is the whole spectrum of devices, from microcontrollers and sensors all the way up to data center devices,” says Ryan Brown, marketing director, Intelligent Systems Group, Intel.
Hardware is one of the pieces of the staggeringly larger puzzle. The other part is 35 trillion gigabytes of data. “Making the best advantage of that data in a connected world will drive new solutions,” predicts Brown.
As an advanced manufacturer of integrated circuits, Intel plans to be part of creating these new solutions. To date, it has developed two approaches to help developers: Intelligent Systems Framework (ISF) and the Intel System Studio. The tools and software available from these programs make it easier for design engineers to go to market with smart devices.
ISF Overview
Recognizing many of the design engineers who are familiar with Intel products are not experts at embedded system design, Intel developed ISF as a how-to guide for configuring smart devices. According to Brown, ISF is about having connected, secured and managed systems. Simple connectivity, especially at the expected scale, without management and security creates problems.
“There is nothing worse than untrusted data, because you are making decisions upon it,” notes Brown.
Connectivity, security and management requirements have been Internet issues for users for many years. Unlike user-driven enterprise and consumer designs, however, machine-drive embedded designs have quite different problems.
“As you move into this embedded space, it becomes very fragmented--in many cases proprietary, depending on whose equipment you bought in the last 20 years,” Brown says. “We saw an opportunity to start putting together a framework of basic capabilities your solutions should have in them to be able to connect to this new world order, this Internet of Things.”
Partnering with several companies, Intel introduced the first revision of ISF in September 2012, and since then it has been bringing an ecosystem together. Delivering a solution that is easy to integrate and poised for a long useful life requires more than one company to bring all the disparate pieces together.
Today, Intel and its partners have more than 50 products shipping for industrial, automotive, retail, entertainment and technology applications based on ISF 1.0.
Integrating Intel System Studio
With the framework in place, Intel’s next step addresses the major concerns of developers. As noted in VDC Research’s “Strategic Insights 2012: Embedded Software & Tools Market,” the most important factor in the development of products in the embedded space is product quality. Device system performance, time-to-market, engineering productivity, development cost and power requirements are among the other Top 10 factors.
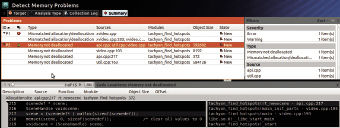 Fig. 1: Intel VTune Amplifier includes power profiling by providing in-depth, SOC-wide visibility of events and analysis of CPU and GPU activities. |
UBM Electronics’ “2012 Embedded Market Survey” lists debugging tools, schedule and programming tools as three of the Top 5 items that designers would like to change to improve their embedded design activities.
Addressing these concerns, the Intel System Studio provides deep system-level insights into power, reliability and performance to help accelerate time-to-market of Intel architecture-based embedded and mobile systems, says Peter Horn, an embedded software strategist at Intel. Debuggers, analyzers, compilers and libraries deliver the insight and system capabilities. A few examples demonstrate the capabilities of the Intel System Studio.
“For time-to-market, we added optimized building blocks, like encoder-decoder libraries and debuggers that provide both high-level language debugging capabilities and full hardware insight to speed up development,” says Horn.
“The biggest help for a developer is if you provide him code that he can use 1:1 directly,” he adds. The building blocks and libraries in the Intel System Studio target this approach. “The content of these libraries goes far beyond what I have seen in other tool chains,” Horn says.
For example, full encoder-decoder signal processing capabilities address mathematical algorithms such as Fast Fourier transforms (FFTs) from proven and optimized code.
Debugging delivers part of the system-level insight. Intel’s JTAG debugger is a high-level language debugger for C++ language. It offers views for the peripheral registers in all the peripheral intellectual property (IP) blocks on the system on a chip (SOC). Besides standard debugging, it provides visibility to thousands of registers--as well as the capability to modify the values. The bit-field editor in the debugger shows the content of these bit fields in a human-readable way.
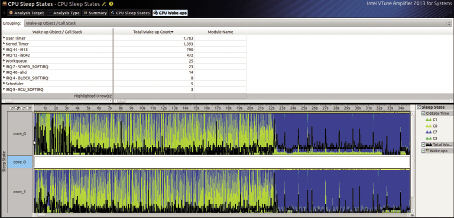 Fig. 2: Intel Inspector simplifies the detection of memory problems. |
The debugger also contains the manual to provide information when the developer needs it. System Visible Event Nexus technology (SVEN), a software technology and application programming interface (API) in the Intel Debugger, provides a method of transmitting events from any operating system context, driver and firmware.
In addition to the Intel debugger, a second GNU Debugger (GDB) optimized for Intel architecture provides information--including application defect analysis and the ability to determine thread errors as part of the debug process.
Intel VTune Amplifier and Intel Inspector are analyzers in the Intel System Studio. On-chip counters read by the Intel VTune Amplifier show the number of cache methods to help designers determine the optimum performance and power balance in a system. This tool identifies wake-up causes, timers triggered by application, and interrupts mapped to hardware interrupt level, and displays CPU core frequencies and events that wake up the processor at the source code level (see Fig. 1).
The Intel Inspector analyzer identifies memory and threading coding defects, including memory leaks, invalid access, plus data races and deadlocks. It supports remote data collection, debugger breakpoints, and break on selected errors (see Fig. 2).
Connecting the M2M Dots
The Intel System Studio provides deep system-level insight to the underlying silicon device, as well as the operating system.
It does so to aid “efficient development, debugging, performance and power optimization of the embedded system,” says Horn. “The debuggers are able to display all SOC elements, and our analyzers utilize counters of the system to provide accurate performance and power analysis.” DE
Add these capabilities to ISF, and developers may have a new way to expand the IOT.
Randy Frank is a contributor to DE. Send e-mail about this article to [email protected].
More Information

Randy Frank is a freelance technology writer based in Arizona. Contact him via [email protected].
Follow DE


About Us · Contact Us · Editorial Team · Advertising · Privacy Policy · Subscriber Services · © 2026 Digital Engineering 24/7 · Peerless Media