Helping design and engineering professionals discover, evaluate and specify technologies and processes that shorten the design cycle and enable success.

May 2026 Special Focus: Artificial Intelligence in Design and Simulation
In this Special Focus Issue, learn about the latest developments in the integration of artificial intelligence into engineering workflows.

Design & Simulation Software Guide 2025
In this Special Issue, Digital Engineering presents its second annual guide to design and simulation software vendors.
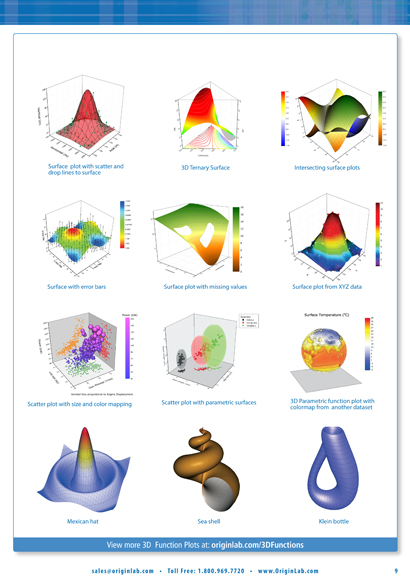 Types of visualization options available in Origin, from the company's online booklet.
The use of simulation in engineering is shifting from sequential (one at a time) to parallel (many at a time, running simultaneously on high-performance computing systems). The move is precipitated largely by optimization and lightweighting, which require evaluating a series of design options or families of designs to identify the best candidates.
But this adds a new dimension to simulation. Now, you need a way to view the results -- the best ones, as identified by the software's algorithm -- in a comprehensible fashion to understand the correlations between different parameters and the geometry. For example, what happens to the aerodynamic performances of the vehicle when you increase the curvature of the hood by a certain degree? Or how does the position of the side mirrors affect the car's drag?
For computation (number crunching), engineers usually rely on a specialized program like MathWorks MATLAB, often called Excel for engineers. For shape or topology optimization based on 3D CAD geometry, they use software like Altair's OptiStruct or SolidThinking Inspire. But underneath all the 3D visuals and graphics, the parameters, loads, stresses, and safety factors are just numbers. So could Excel be a way to display and understand the simulation results?
Excel may be way out of its depth because it's not designed to display a large volume of numbers in a visually digestible fashion, but OriginLab's data analysis and plotting program Origin might fit the bill. According to the company, its software is used by those in "research institutions, and colleges and universities across various disciplines including physics, chemistry, biology, pharmacology, engineering, and manufacturing" Excel data can be copied and pasted into Origin environment or imported from worksheets. Furthermore, Origin can open Excel worksheets directly.
Origin supports multiple worksheets with "up to 90 million rows and 65527 columns per sheet," says the company. For visualization, it offers "over 100 built-in graph types," including the contour, 2D, and 3D types. The latest release, Origin 9.1, includes plotting numbers as ternary surfaces, which could be an option for those who like to study optimization results through response surfaces.
A higher end version, OriginPro, includes 3D surface to XYZ data points and advanced statistics handling. For those who work with testing instruments, OriginPro offers signal processing.
“Although this is a minor version release, we have added a number of new features and improvements based on feedback we received from customers throughout the past year,” said Dr. C.P. Yang, OriginLab’s founder and CEO. “The new graph types and redesigned axis dialog in Origin 9.1 will provide users with many more options for visualizing and presenting their data.”
There is tight integration between Origin and MatLab. A function called MatLab Console allows you to import data directly from MatLab to Origin. Graphics, charts, and interactive visual data presentations created in Origin can be published as files viewable in the freely distributed Origin Viewer.
As optimization becomes the norm among simulation users, software providers are also working to incorporate robust tools to analyze, view, and share simulation results. The same need also exists in the emerging simulation lifecycle management (SLM) software market. Origin offers a good way to present numerical data as interactive graphics, but it will take some efforts to convert simulation results into worksheets.
Other vendors like TecPlot hopes to capture the same market with its software Chorus, a CFD post-processor with the option to further analyze the results.

Kenneth Wong is Digital Engineering's resident blogger and senior editor. Email him at [email protected] or share your thoughts or suggestions at digitaleng.news/facebook.
Follow DEJoin over 90,000 engineering professionals who get fresh engineering news as soon as it is published.


About Us · Contact Us · Editorial Team · Advertising · Privacy Policy · Subscriber Services · © 2026 Digital Engineering 24/7 · Peerless Media