Helping design and engineering professionals discover, evaluate and specify technologies and processes that shorten the design cycle and enable success.

May 2026 Special Focus: Artificial Intelligence in Design and Simulation
In this Special Focus Issue, learn about the latest developments in the integration of artificial intelligence into engineering workflows.

Design & Simulation Software Guide 2025
In this Special Issue, Digital Engineering presents its second annual guide to design and simulation software vendors.
In 1954, two crashes involving the world’s first commercial jet airliner, the de Havilland Comet, brought the words "metal fatigue" to newspaper headlines and into long-lasting public consciousness. The aircraft, also one of the first to have a pressurized cabin, had square windows. Pressurization combined with repeated flight loads caused cracks to form in the corners of the windows, and those cracks widened over time until the cabins fell apart. In addition to being a human tragedy in which 68 people died, the Comet disasters were a wake-up call to engineers trying to create safe, strong designs. (See "Notable Resources" below.)
Designers normally consider the most important safety consideration to be the overall strength of the component, assembly, or product. With this in mind, engineers aim for designs that will stand up to the probable ultimate load, and add a safety factor to that, for insurance.
In operation, however, the design is unlikely to experience static loads. More frequently, it will experience cyclical variation, and undergo multiple application of such load variation, which may lead to failure over time.
The primary tool for both understanding and being able to predict and avoid fatigue has proven to be FEA.
What Is Fatigue?A generally accepted definition of fatigue is: "failure under a repeated or otherwise varying load, which never reaches a level sufficient to cause failure in a single application." The symptoms of fatigue are cracks that result from plastic deformation in localized areas. Such deformation usually results from stress concentration sites on the surface of a component, or material variability may result in a preexisting, virtually undetectable, defect on or just below the surface. FEA can predict stress concentration areas, and can help design engineers predict how long their designs are likely to last before experiencing the onset of fatigue. The mechanism of fatigue can be broken down into three interrelated processes:
1. Crack initiation
2. Crack propagation
3. Fracture
FEA stress analysis can predict crack initiation. A number of other technologies, including dynamic nonlinear analysis, can study the strain issues involved in propagation. Because design engineers principally want to prevent fatigue cracks from ever starting, fatigue analysis is found in many superior applications. COSMOSWorks and COSMOSDesignSTAR offer fatigue life analysis, and this article addresses fatigue from that viewpoint. (See "Crack Propagation" below. For a COSMOSDesignStar review, click here.)
Two principal factors govern the amount of time it takes for a crack to start and grow sufficiently to cause component failure: the component material and stress field. Current methods for determining fatigue testing of materials go back to the 19th century, when August Wöhler set up and conducted the first systematic fatigue investigation. Standard laboratory tests apply cyclical loads such as rotating bend, cantilever bend, axial push-pull, and torsion. Scientists and engineers plot the data from such tests to show the relationship of each type of stress to the number of cycles of repetition leading to failure—or S-N curve. Engineers can derive the stress level a material can endure for a specific number of cycles from the S-N curve.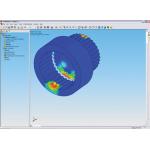
› › Plot showing factor of safety at various locations of a model of gears in a machine used for manufacturing automation.
The curve splits into low- and high-cycle fatigue; low-cycle fatigue generally occurs below 1,000 cycles. Some materials, such as low-carbon steels, show a flattening off at a particular stress level—referred to as the endurance or fatigue limit. Materials that contain no iron show no endurance limit.
It would seem that parts designed to avoid stresses exceeding the known endurance limit should not fail in service, but endurance limit calculations do not account for localized stress concentrations that may lead to crack initiation. Fatigue load history, as determined by testing with rotating bend tests, provides information about mean and alternating stress. Cracks propagate only under tensile loads. Thus, if the load cycle induces compressive stress in the area of a crack, it will not produce more damage. However, if the mean stress shows that the complete stress cycle is tensile, the whole cycle will cause damage.
Physical testing is clearly impractical for every product design. In most cases, designers need the ability to predict component fatigue life accounting for anticipated service loads and materials.
The fracture portion of the fatigue process essentially occurs instantaneously, so the total component life can be defined as:
CAE programs use three major methods to determine the total fatigue life:
1. The stress life approach (SN) is based upon stress levels only, and uses the Wöhler method only. It is the easiest to implement, and provides a good representation of high-cycle fatigue—although it’s unsuitable for components with areas of plasticity and has poor accuracy for low-cycle fatigue.
2. Strain life (EN) provides more detailed analysis of plastic deformation at localized regions and works well for low-cycle fatigue applications.
3. Linear Elastic Fracture Mechanics (LEFM) assumes that a crack is already present and detected, and predicts crack growth with respect to stress intensity. This method is useful for large structures in conjunction with computer codes and periodic inspection.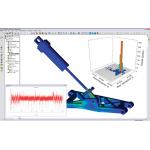
‹ ‹ Automotive suspension fatigue analysis results, including rainflow counting plot and a plot showing the variable loading used as input in the COSMOS fatigue life analysis.Fatigue Life Calculation for Designers
Since first being recognized, fatigue has been found at the root of the failure of many mechanical components, such as automotive suspensions, gear assemblies in many different kinds of machines, turbines and other rotating equipment operating under intense, repeated cyclical loads. Because of its ease of implementation and the large amounts of material data available, the most commonly used method for predicting fatigue life is SN.
Some other considerations, such as constant and variable amplitude loading are important to calculation of fatigue life. Constant amplitude loading considers a component subjected to a constant amplitude, constant mean stress load cycle. By using an SN curve, designers can calculate the number of such cycles leading to component failure quickly. Variable amplitude loading reflects the fact that most components undergo a varying load history in real life conditions, on both amplitude and mean stress.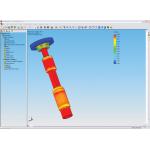
› › COSMOS fatigue life analysis results showing fatigue damage to the spindle of a milling machine.
FEA provides excellent tools for studying fatigue with the SN approach, because the input consists of a linear elastic stress field, and FEA enables consideration of the possible interactions of multiple load cases. Typically, users set the system to calculate the worst-case load environment, making it possible to obtain a number of different fatigue computation results, including life plots, damage plots, and factor of safety plots.
In addition, FEA can generate plots of the ratio of the smaller alternating principal stress divided by the larger alternating principal stress, called a biaxiality indicator plot, as well as a Rainflow Matrix chart. The latter is a 3D histogram in which the x and y axes represent the alternating and mean stresses, and the z axis represents the number of cycles counted for each bin.
The tools and approaches discussed here can help designers improve component safety while reducing overengineered, heavy, and costly designs. By making use of today’s technology to avoid fatigue, catastrophes can often be averted. And on a day-to-day basis, fatigue-safe design reduces service failures and gives designers greater opportunities to design new products instead of fixing old problems.
Stephen Endersby is the European technical manager of COSMOS analysis products at SolidWorks. He has a Ph.D. in mechanical engineering from the University of Northumbria, England, and an MS in aeronautical engineering from Cranfield University, England. Send your comments about this article through e-mail by clicking here. Please reference "Fatigue, EoA March 2006" in your message.
COSMOSWorks, COSMOSDesignSTAR
SRAC/SolidWorks Corp.
Santa Monica, CA
Two physical mechanisms drive the process of fatigue crack growth. Under a cycling load, slip planes in the microstructure of the material grain move back and forth, causing micro extrusions and intrusions on the surface of the component. These are far too small to see—measuring between one and 10 microns in height—but can be considered to be embryonic cracks (Stage I).
When the Stage I crack reaches the grain boundary, the mechanism transfers to the adjacent grain. Stage I cracks grow in the direction of the maximum shear, 45 degrees to the direction of loading.
At approximately three grains in size, the crack behavior changes, because the crack has become large enough to form a geometrical stress concentration (Stage II). Stage II cracks create a tensile plastic zone at the tip, and after this point, the crack grows perpendicular to the direction of the applied load. —SE

DE's editors contribute news and new product announcements to Digital Engineering. Press releases may be sent to them via [email protected].
Follow DEJoin over 90,000 engineering professionals who get fresh engineering news as soon as it is published.


About Us · Contact Us · Editorial Team · Advertising · Privacy Policy · Subscriber Services · © 2026 Digital Engineering 24/7 · Peerless Media
;)