

Latest News
July 2, 2008
By Matt Peick
All business decisions start at the same place — the bottom line. The methods for boiling down business investment decisions to the bottom line are well-known: net present value (NPV), marginal acceptable rate of return (MARR), and payback period. And yet, when it comes to software investment decisions — such as upgrading to the next release level, or adding an entirely new software platform — many companies abandon the critical financial evaluation of their investment and focus only on the technology evaluation. Clearly, a software tool under consideration must have technical value, but once the technology decision is made, the question remains of its total value to your company.
 |
At the pace technology advances, the life of a software investment can be as short as six months. This is one area where the traditional investment evaluation tools do not apply. Both the NPV and MARR techniques take into account the investing and revenue sides of the equation and, more importantly, consider the time value of money. This approach is critical when evaluating capital investment projects lasting multiple years. But the time value of money becomes negligible when the investment life is a year or less. In this case, the payback period is more applicable. It refers to the length of time it takes to recoup all investments. The NPV analysis, without the time value of money, also helps in looking at the payback period.
The format of this analysis will simply look at the investing and revenue sides of the cash flow. Capturing all of the true investments and all of the true revenues is critical. From the final cash flow, two decision criteria will emerge; the NPV and the payback period. Based on the predetermined life of the project, the final sum of the monthly cash flows is the value, or NPV, of the project. A positive NPV indicates a sound investment, while a negative NPV indicates a losing proposition. Following the running cash flow time line, the point at which the cash flow switches from negative to positive represents the payback period. An acceptable payback period could be as short as one half of the expected life of the software.
The investing side of the analysis includes the software license fees, any service contract costs, any training fees, and the learning-curve costs. The first three are flat costs and typically occur at one time in the first time period. The learning curve costs are a bit more difficult to quantify, but are critical to the analysis. Any time spent out of the office for training represents the first part of the learning-curve costs. The second part is lost productivity for employees learning and applying the new software back in the office. One way to quantify this is to estimate the percentage of an employee’s time that will be spent learning the software for the first week or two. The value of the learning-curve costs has to be in bottom line dollars — not in billable dollars.
The revenue side of the analysis includes maintained sales, new sales, and productivity increase. The maintained sales are those sales that, if you were to not invest in the software, would be lost. When we start talking about software that your customers require for doing business with them, the maintained sales can dominate, and make the analysis easy. The new sales are those sales that can be gained by investing in the software. The revenue for new sales can also dominate the analysis if the entire motivation for the software investment is targeting new customers, or simply required to maintain capacity. Staying consistent, all revenue side entries should be expressed in terms of margin dollars as opposed to sales dollars. Similar to the learning curve, the productivity increase dollars are more difficult to quantify but are critical. Again, one way to quantify this is to estimate the percentage of an employee’s time that will be saved by implementing the new software.
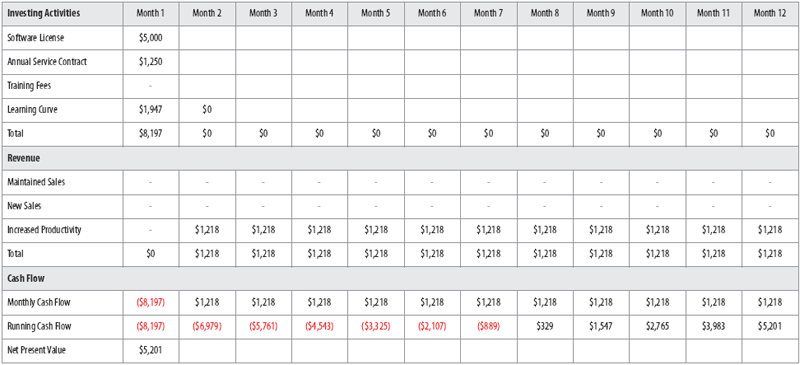
Let’s look at a simple example (see table on page 54). Under consideration is adding an FEA package to an engineering department. The costs and fees for a network license are fixed and will all be incurred immediately. Two of the team will be sent to a local two-day training course. It is estimated that there will be a 10% decrease in productivity for the first two weeks (for the learning curve) and then an average 25% productivity increase spread over the year. From this analysis, the NPV is $2,107 at six months and $5,201 at one year. The payback period is slightly more than seven months. If the acceptable payback period is six months, some change to the equation must occur before the investment makes sense — such as seeking out new sales or ensuring higher productivity increases. If the payback period of seven months is acceptable — the decision is done.
No financial analysis tool is a guarantee of making the right decision, but in today’s market of ever-changing software and technology platforms, a critical look at the bottom line of every investment will only put companies in a better position to succeed.Matt Peick is vice president of engineering at Perbix Machine Company in Golden Valley, MN. You can send comments to [email protected].
Subscribe to our FREE magazine, FREE email newsletters or both!
Latest News
About the Author
DE’s editors contribute news and new product announcements to Digital Engineering.
Press releases may be sent to them via [email protected].


