

Latest News
January 1, 2011
By Mike Peery
The interdependent advancement of alternative fuels and engine technologies is a key component of what is becoming a significant and global effort to reduce our reliance on petroleum-based fuels and the pollution they create. With automobile and truck transportation accounting for two-thirds of domestic oil use, identifying and exploiting new fuel sources is becoming particularly critical in the U.S. It also requires new combustion engines designed to perform at optimal efficiency for each new fuel.
 |
Discovering, studying and analyzing these fuel compounds present a variety of fresh challenges for researchers, but new high-tech research tools are emerging to help in the efforts. Researchers such as Jacqueline Chen and Joseph Oefelein at the Combustion Research Facility of Sandia National Laboratories in Livermore, CA, working in conjunction with the U.S. Department of Energy (DOE), have undertaken what may prove to be significant research to help unravel the complexities of these alternate fuels and create a body of work that will help inform the design of future combustion engines.
Both experts in computational combustion science, Chen and Oefelein found it critical to develop high-fidelity simulation approaches to their research that take full advantage of some of the world’s fastest supercomputers operated by DOE’s Office of Science. To quickly interpret their computationally intensive data, Oefelein and Chen rely on Tecplot 360, an advanced computational fluid dynamics (CFD) visualization and analysis software that combines engineering plotting and data visualization into one tool.
Chen and Oefelein are using these tools to harness the massive amounts of data they need to better study the burning processes of a variety of fuels, which will ultimately help engineers to design internal combustion engines that burn alternative fuels in a way that maximizes performance and minimizes emissions.
Petroleum-based fuels have enjoyed a certain ubiquity since the mid-1850s. Such longevity has allowed industry experts to develop a pretty thorough understanding of how internal combustion engines function on gasoline and diesel. This research cannot be extended to alternative fuels, however, because each fuel responds dramatically differently to diverse temperatures and pressures. Gathering data and building new alternative-fuel models requires extremely reliable, complicated, and nuanced computational models to generate new, appropriate data.
In specific terms, the Sandia National Laboratories researchers are performing high-fidelity simulations to understand the complex thermo-chemical interactions in internal combustion engines using carbon-neutral fuels such as biofuels, and alcohols like ethanol and dimethyl ether. A primary goal is to maximize the way alternative fuels are used by the next generation of internal combustion engines.
“You always want a clean-burning, highly efficient system,” says Oefelein. “And you want it to be a stable system, meaning that there are no combustion instabilities or transient types of processes that will damage the engine.”
To develop predictive models that will help design clean and fuel-efficient engines, Oefelein and Chen are using two computational methodologies:
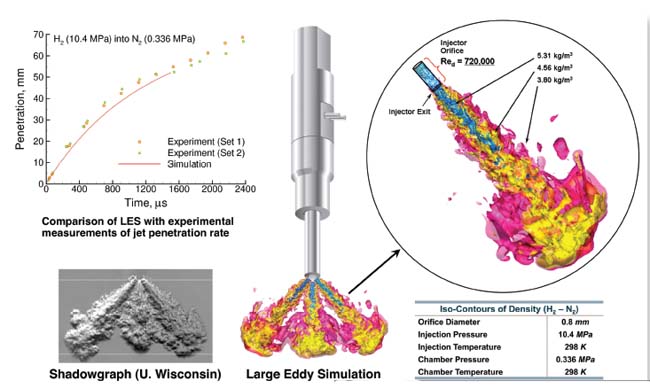
1. Large eddy simulation is a numerical technique used to solve the partial differential equations governing turbulent fluid flow. With this approach, the energy containing eddying motions that are dependent upon the geometry of the combustor are resolved numerically, and the dissipative small-scale turbulence and combustion scales require closure models.
2. Direct numerical simulation investigates the entire range of spatial and temporal scales of turbulence and flames, and therefore is restricted to a limited dynamic range of scales. Often, this approach is well-suited for studying the micro-scales of turbulence chemistry interactions—where turbulent mixing scales interact with the reactive flame and ignition scales.
These two approaches complement each other, with large eddy simulation characterizing the large-scale entrainment and mixing processes, and direct numerical simulation providing sub-grid information regarding micromixing and reaction.
Both techniques are computationally intensive, generating petabytes of data in many cases—with each petabyte representing more than six times the amount of data found in the U.S. Library of Congress archive.
“Ten years ago, this research was at the terascale level in terms of computational speed. Now it’s at petascale,” says Chen. “In a few years, we’ll be at exascale.”
As computing power continues to increase, Chen and Oefelein will be able to simulate a wider dynamic range of scales. Because the scaling of turbulence with Reynolds number (the ratio of inertial to viscous forces) is so challenging, researchers can only simulate a 10-fold increase in dynamic range of turbulence scales for every 1,000-fold increase in computing power. As a result, no one method can resolve the entire range of scales relevant to practical combustors in the foreseeable future. Instead, a multi-scale approach is required in which different, well-suited methods, like those that Chen and Oefelein are using, are necessary to bridge the gaps between the differing ranges of scales.
Plotting the Data
Oefelein and Chen discovered Tecplot 360 as a way to interpret and visualize the massive amounts of data their research required. Because they routinely perform calculations on supercomputers located offsite, using a computer dashboard with a user interface and intuitive drop-down menus, they send Tecplot images such as isocontour plots, 2D and 3D plots, and animations back to their home facility, which helps them hone in on key statistics and identify critical trends.
“It’s a lot easier to examine visual images than it is to wade through numbers or statistics,” says Chen. “By looking at isocontour plots or volume renderings, we can see what’s going on at a broad perspective, and then zoom in and gather statistics at a finer level.”
Analyzing the data visually also helps provide a more easily understood diagnostic view.
“If there’s a problem with the way the code or numerical parameters were set up, it’s much faster to spot these anomalies visually than by printing out rows and rows of numbers,” says Chen.
Visualization is the key that helps the duo present their results in a way that’s easy for others to grasp.
“Visualization software guides both our research and our presentation of results,” says Oefelein. “When we’re done and we’re ready to publish a paper, it helps us to tell our story and summarize what we saw in a concise way.”
More Info:
Tecplot
Mike Peery is president of Tecplot, Inc. Contact him via [email protected].
Visualizing data helps researchers at the Sandia National Laboratories understand alternative fuels, which could help design better combustion engines.
Subscribe to our FREE magazine, FREE email newsletters or both!
Latest News
About the Author
DE’s editors contribute news and new product announcements to Digital Engineering.
Press releases may be sent to them via [email protected].


