Helping design and engineering professionals discover, evaluate and specify technologies and processes that shorten the design cycle and enable success.

May 2026 Special Focus: Artificial Intelligence in Design and Simulation
In this Special Focus Issue, learn about the latest developments in the integration of artificial intelligence into engineering workflows.

Design & Simulation Software Guide 2025
In this Special Issue, Digital Engineering presents its second annual guide to design and simulation software vendors.
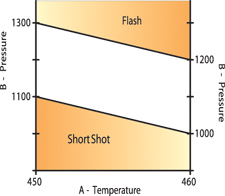
Response surface methods (RSM) are powerful optimization tools in the arsenalof statistical design of experiments (DOE). However, a common misconception isthat DOE applies only to process studies where factor ranges form orthogonal regions,such as a square or a cube. This holds true for the well-known factorial options:two- or three-level, described mathematically as 2k and 3k, respectively, wherek represents the number of factors. To see the problem, consider the operatingwindow shown in Figure 1 (below) for a hypothetical injection-molding process.
The pressure needed to fill an injection mold depends on the viscosity of themolten plastic—the higher the temperature, the less viscous the plastic. If doneincorrectly, the process fails, either by underfilling the mold (short shot) orby putting in too much, creating parts with flash. Clearly, if one tried to forcea standard (square) factorial design into this diagonal region, it would comeup far short of the operating extremes.
|
|
|
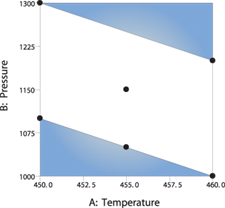
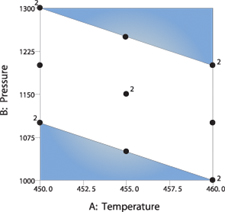
Figure 1: Constraints on a hypothetical injection-molding process. | Figure 2: This computer-generated D-optimal design comes up short for practicality. | Figure 3: This more practical design is better for the injection-molding process. |
To map out the operating window shown on Figure 1 (above, left), multifactorlinear constraints (MLC) must be imposed to prevent bad things from happeningto the plastic parts at certain combinations of the two key processing factors—temperatureand pressure:
Given any specific MLC, computer programs dedicated to doing DOE, such as Design-Expertsoftware from Stat-Ease, can generate optimal designs that fit the desired operatingregion. For example, the MLCs on making good plastic parts is:
5600 <= 10A + B <= 5800
where A and B represent temperature and pressure, respectively.
It will be advantageous to make use of an algorithmically based design calledD-optimal. To avoid getting into a lot of unnecessary mathematical detail, sufficeit to say that the D stands for the determinant of a matrix that represents howmuch information can be gleaned from any particular combination of process factors.Aided by the computer, a D-optimal selection can choose appropriate factor combinationsin the constrained region to fit a desired polynomial response model. For RSM,this generally extends to second-order terms in a quadratic equation, which fortwo factors is:
^y = b0 + b1A+ b2B+ b12AB + b11A2 + b22B2
The trick is to determine the coefficients (b) in order to develop precise predictionsof the response y—e.g., shrinkage of the injection-molded plastic part. (Statisticiansuse the "hat" ]^] to differentiate between a predicted response and those thatwere actually measured.)
Figure 2 (above, middle) shows a D-optimal selection of points for fitting aquadratic model to temperature and pressure data kept within the MLC for our plasticsprocess. To the straight eye the design shown in Figure 2 is an odd guy. For example,doesn't it seem a bit bizarre that the computer put a point at the midpoint ofthe bottom edge but not the top?
It turns out that a purely D-optimal design may fill out the desired space withenough unique factor combinations to fit the desired polynomial model, but itoften comes up short on practicality from an engineering perspective. Figure 3(above, right) illustrates a better design, beefed up with additional runs.
How does this selection of points stack up against that chosen by the computeron a strictly D-optimal criterion (as show in Figure 2, above). Notice that wereplicated a number of points as indicated by the 2s. This provides a good measureof pure error. We also added several new points that fill in spaces, such as themiddle of the upper constraint, thus providing a way to check on the model-adequacyvia a statistic called "lack of fit."
Real-Life Applications for Optimal Design
Andy Scott, an investigator in the Pharmaceutical Development Sciences departmentat GlaxoSmithKline's (GSK) Research and Development center in the United Kingdom,asked the authors for advice on how to deal with a complex constraint on two airpressures, designated as A and B. The process, the purposes of which were notdisclosed by GSK, required differential pressures to maintain a flow of air inone direction only. The constraints given by Andy are detailed below:
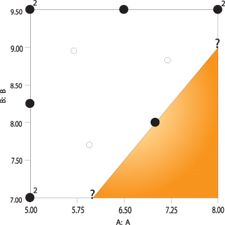
The last requirement is a multifactor linear constraint that can be expressedmathematically as 1<= B - A. This is an ideal application for D-optimal design.Aided by Design-Expert software, we laid out the experiment as shown in Figure4 (left). It's geared to fit a quadratic model, but we augmented the base D-optimaldesign (the big, black dots) with replicate points for estimation of pure error(the ones designated by 2) plus additional unique runs to test for lack of fit(small, open circles). This latter set of runs, called checkpoints, fills in openspaces.
Notice in Figure 4 that only one run falls along the diagonal operating constraint.If this boundary defines an area of interest, it would be easy to add the verticesalong this edge at the (A, B) coordinates of (6, 7) and (8, 9), which are identifiedwith question marks. The lesson here is that there's nothing sacred about D-optimalor any other computer-generated design. However, as the number of factors increasesto three and beyond, it becomes very difficult to visualize the design space.Then you'd better have a good software program for laying out a sensible design.
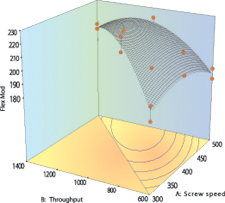
Here's a final example, also from real life, which deals with a manufacturer'sequipment specifications that prohibit certain combinations of factors. A processorof high-tech plastic sought optimum levels for two key factors affecting operationof an extruder:
A. Screw speed, 300-600rpm
B. Throughput, 600-1,400pph
The company desired the highest possible throughput of product exhibiting maximumflex modulus in psi (pounds per square inch). However, due to torque limitations,only a limited amount of material, 600pph (pounds per hour), could be processedthrough the extruder when it ran at the lower screw speed (300rpm). Only at thehigher screw speed of 500rpm could the maximum desired output (1,400pph) be attained.It did not pay to break the machine, so we derived an MLC that specified the operatingboundary:
B - 4A <= -600
The experimental design and test results (flex modulus in psi) are shown in Table1 (page 15). The factor settings were chosen via D-optimal criterion by Design-Expertsoftware, which augmented the design with four replicates for estimation of error(see column labeled "ID" to help identify these) and three check points to testlack of fit. The actual run order was randomized to counteract time-related externalvariables such as machine-drift, changes in ambient temperature and humidity,etc.
|
|
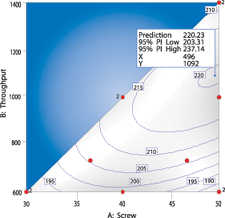
Figure 5a: This plot shows location of the design points and 2D contours of predictedresponse. | |
Figure 5a (above, left) shows the location of the design points and 2D contoursof predicted response for flex modulus (fitted by the software via least-squaresregression to a quadratic model). The maximum flex modulus

DE's editors contribute news and new product announcements to Digital Engineering. Press releases may be sent to them via [email protected].
Follow DEJoin over 90,000 engineering professionals who get fresh engineering news as soon as it is published.


About Us · Contact Us · Editorial Team · Advertising · Privacy Policy · Subscriber Services · © 2026 Digital Engineering 24/7 · Peerless Media