

Latest News
December 1, 2006
By Al Dean
In the world of analysis and simulation, the workflow usually follows the preprocess, compute, postprocess workflow. Unlike many other engineering and design disciplines, the software is in many respects fragmented, with companies offerings a wealth of pre- and postprocessors as well as solving engines aplenty. Often, the problem you face is that you’re running several solvers (for different purposes) and different postprocessors. This makes the reporting process very complex.
Surely, a better way would be to use the preprocessor code you need, and then use a common postprocessor for interrogating, inspecting, and reporting on your analysis and simulation data. In addition to this, its worth considering the fact that you’re typically going to need the ability to do more than just create fringe and contour plots and dive into your data to compare not just single datasets, but those generated through a range of iterative processes. After all, if you’re looking to create the optimum product, then the more information you have about its behavior, the greater your chances of achieving exactly that.
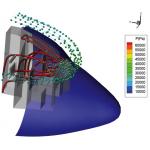 |
| TecPlot 360 |
> > This TecPlot 360 screen shot represents an analysis of airflow during a sudden decompression of a passenger jet cockpit.
This is where TecPlot 360 from TecPlot, Inc. (formerly Amtec Engineering) CFD (computational fluid dynamics) and numerical simulation visualization software fits into your world.
Load and Preview Huge Datasets Quickly
The starting point for any similar software is always going to be loading the data into the system. TecPlot 360 includes a range of options for handling datasets from a variety of sources. Since TecPlot Inc.’s background is within the CFD industry, the availability of CGNS, Fluent, KIVA, and PLOT3D (including name and boundary files) should not come as a surprise. In addition, TecPlot 360 allows you to directly read FEA-focused datasets from Abaqus, ANSYS, FIDAP, LS-DYNA, MSC.Nastran, MSC.Patran, PAM-CRASH, and SDRC-IDEAS. TecPlot 360 can also process Excel or comma/space delimited files, with the ability to process those for titles, variables and data, set filters, and the like. This means that you can load your data and preview it in a very quick time frame.
 |
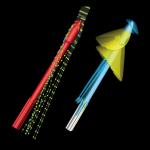
| TecPlot 360 |
< < These images of a gas-swirl burner simulation indicate the nondimensional axial mean velocity components divided with maximum axial mean velocity as measured in the y,z plane.
Once your data is in the system, TecPlot 360 offers you an astounding amount of tools to inspect your data, letting you work through the process of managing that data sensibly, and then gathering the information you require from resulting data. Finally, it has a wealth of output media to support the reporting process.
TecPlot 360, in addition to providing the usual interactive slicing/sectioning, iso-surface creation, and advanced particle tracing tools that you require, has been developed to allow you to handle extremely large and multiple datasets in the same session for comparison and verification. The key here is that it provides you with the tools to do this efficiently so that you’re not spending an inordinate amount of time managing your data. Not surprising given the developers’ backgrounds in the aerospace industry.
Getting Into the Zone
Existing functionality, such as zones, shows this functionality off.
A data file can be divided into different zones (either automatically or manually) so you can inspect each zone individually—making manipulation of the data more efficient. Typically, a zone might be defined based on its physical coordinates or subassembly/system, or zones may be based on the material.
 |
| TecPlot 360 |
> > A TecPlot 360 visualization showing a separated flow and vortex shedding simulation.
Another good example of its functionality is that TecPlot 360 makes the handling and exploration of data much more efficient by using a “load on demand” concept. This means that the system only holds the exact data you’re using in memory at a particular time, rather than the complete dataset. For example, you might be looking at a temperature contour, which loads the x,y,z and temperature values. You might then want to switch to a new variable to contour (i.e., pressure). Unlike previous versions and other systems that would need all the data in memory, TecPlot 360 loads the pressure values and unloads temperature.
Lots for Reporting
Of course, data loading and management are all very interesting, but what you want to do is create the plots you need to gain a better understanding of how your product is behaving. One of the most powerful capabilities within TecPlot 360 is the ability to load and visualize multiple datasets in a single session. This means that you can cross-reference data, allowing you to do many things simultaneously, from comparing different studies and materials to forces and load cases.
For me, two of the most interesting applications are the ability to present simulated data alongside test data and the ability to combine both FEA and CFD data to visualize fluid-structure interaction.
Once you have your plots, containing multiple frames and cross-referenced results data, what you really need is to be able to output those representations for use in your reporting. Of course, these days, reports can be much more than simple static printed documents. While TecPlot, as you’d expect, allows you to either copy/paste plot data or paste directly into PowerPoint, Word, and Microsoft Office applications, it also allows you to do more.
 |
| Image courtesy of TecPlot, Inc. |
< < A TecPlot 360 visualization os the sun’s corona.
First, you can output very high-quality vector and raster formats for inclusion in reports and for use on the Web (including JPEG, PNG, TIFF, BMP, WMF, PostScript, and EPS). Second, TecPlot 360 also allows you to take your animation visuals and use them in PowerPoint (or any other media-ready application, such as the Office tools and PDF) or publish them directly to the Web.
A Toolset for All That Data
When you’re looking at adopting analysis and simulation as part of your product development process, be sure that it dovetails into the complete process. While the MCAD companies are, in many respects, taking care of the associativity between MCAD and CAE/FEA/CFD, the real bottleneck is still the creation of reports and documentation of the simulation work you carry out. After all, in these days of traceability and holistic documentation for legal and regulatory requirements, you need to be certain that those vital documents are created accurately and quickly, so that you can get back to the core challenges of improving product quality, reducing cost, and bringing innovative products to market.
TecPlot 360 offers a massive range of platform-independent tools (it’s available for all OS variants, including OS X), much of which we’ve glossed over here. TecPlot 360’s toolset allows you to take your raw analysis data, interrogate it, make decisions based on that information, then document the process—all as efficiently as possible, however large and unwieldy your data might be.
Al Dean is Technology Editor of the UK’s leading product development and manufacturing journal, MCAD and is Editor of Prototype, for the rapid prototyping and direct manufacturing industry, both available by clicking here. Send your comments about this article through e-mail by clicking here. Please reference “TecPlot Review” in your message.
TecPlot 360 At a Glance
TecPlot 360
TecPlot, Inc.
Bellevue, WA
> Price: Starts at $1,250 per year single user. Annual network, multi-facility, and perpetual licensing pricing available
> Platforms: Windows 2000, XP, Max OS X, Linux, Unix
> Notes: Evaluation units available by registering at company’s website.
> CFD & FEA Analysis
• 90-plus grid and flow field functions
• Animate displacements
• Data normalization
• Particle paths
• Richardson extrapolation analysis
• Von Mises stress/strain analysis
> Exploration & Analysis
• Ability to change iso-surface values interactively
• Define and use up to four different iso-surface groups
• Fly through data
• Interactively display interpolated variable values and cell indices
• Interactively insert streamlines, streamrods, and streamribbons in 2D and 3D
• Least squares linear, polynomial, power, and exponential curve fits
• Orthographic and perspective projections
• Slicing, iso-surface, contour, extraction tools
> Line, 2D, 3D & Polar Plotting
• Combine plot types, including mesh, contours, vectors, scatter, boundary, shade, lighting effects, and volume attributes to segments of data
• Contour, edge, polar, and vector plots
• Display 1D, 2D, and 3D grids connecting data points
• Scatter and line plots, bar charts, semi-log and log-log plots, error bar plots, splines, curve fits
• Set translucency and specular highlighting on 3D surfaces
> Miscellaneous
• Animation tools
• Export raster or vector plots
• Grid and gridless data
• Multiple color maps
• Optional developer kit
• Plot annotation capabilities
• Spreadsheet views
• Store mathematical expressions for later reuse
Subscribe to our FREE magazine, FREE email newsletters or both!
Latest News
About the Author
DE’s editors contribute news and new product announcements to Digital Engineering.
Press releases may be sent to them via [email protected].


