

Latest News
June 1, 2006
By Rahul Kulkarni and Sugato Deb
As engineers integrate simulation into the product development cycle more and more, the need to validate simulations and characterize designs to help make engineering decisions earlier in the cycle grows stronger. As physical testing moves upstream in the product development process, its role has evolved to characterizing designs and correlating simulations. Here are three easy steps to unite physical test into your product design cycle to reduce development time and prototyping costs.
Physical test adds value to the product design process in two ways. First, you can use physical test data for material properties and for defining boundary or initial conditions, such as road profile and track conditions when designing the suspension system for a vehicle. Using real-world measurements as inputs to the simulation enhances the fidelity of the simulation.
Second, physical tests can validate or calibrate simulation results from such analysis software as COSMOS, NASTRAN, ANSYS, ABAQUS, and ADAMS. Each of these packages can analyze and predict physical parameters that are often dependent on each another, such as temperature, pressure, flow, stress, strain, vibration, and force.
For example, an airplane wing design depends on loading, vibration, and fluid flow—all acting at the same time. Design of such systems often requires multiple simulation applications for different parameters, but simulation accuracy is often questioned due to idealizations. Physical test helps validate simulation results, especially those involving multiphysics. Once validated, you can use simulation for optimization and what-if analysis with confidence.
For design engineers familiar with 3D MCAD, measuring temperature or strain with a DA (data acquisition) system may sound daunting. However, modern DA hardware and software make it possible for even a novice user to get up and running in a matter of minutes. You need three components to take measurements—a transducer/sensor, a DA system, and measurement software.
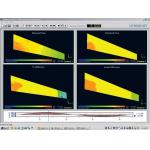 |
| Courtesy of National Instruments. |
‹ ‹ Figure 2: The tight integration of products offer the capability of creating online 3D visualizations of test results while the test is performed.
One, there is typically little direct interaction between the testing and simulation groups. The problem has been the lack of a common visualization and analysis environment for comparing simulations and test results from different vendor products. With such an environment, designers, simulation engineers, test engineers, and product development managers can leverage both simulation and test information and make informed engineering decisions.
NI Insight, an add-on to NI LabVIEW, provides an integrated environment to correlate physical test data with 3D geometry. It first reads geometry from any MCAD program or the mesh from any FEA package in VRML format. It then reads test channel data from LabVIEW, sources such as the DIAdem test analysis and report generation system, or any generic test source that can export data to Microsoft Excel. You then drag and drop the test channels on sensor locations in the 3D representation or use its automation capabilities for this mapping process—handy for a large number of channels based on the sensor coordinates. Thus, this capability connects previously disconnected pieces of data that you need to correlate—test sensor data, the geometry under test, and the location of the sensors on the geometry.
Because test channel data is sparse relative to all the geometry nodes available on the model, NI Insight must interpolate across all the remaining nodes. You can generate a color map on the 3D model to represent all the information from the test channels, which you also can play back any time. This intuitive way of presenting and analyzing test information by mapping it to the 3D geometry also helps communicate test results throughout the organization.
The tight integration of products, such as NI INSIGHT and NI LabVIEW, also enable you to create online 3D visualizations of test results while the test runs. You can leverage this for high ROI test activities, such as dynamically changing the test performed based on the 3D geometry visualization of a large number of test channels. This is often difficult to do with 2D or 3D online graphical representations. An example of this would be dynamically identifying when flow separation occurs behind an airplane wing, a phenomenon that inevitably leads to a stall condition (see Figure 2, above).


