Helping design and engineering professionals discover, evaluate and specify technologies and processes that shorten the design cycle and enable success.

May 2026 Special Focus: Artificial Intelligence in Design and Simulation
In this Special Focus Issue, learn about the latest developments in the integration of artificial intelligence into engineering workflows.

Design & Simulation Software Guide 2025
In this Special Issue, Digital Engineering presents its second annual guide to design and simulation software vendors.
Mike Peery is the president and CEO of Tecplot, Inc., of Bellevue,Washington. As its leader, he is called upon to solve visualizationproblems encountered by companies needing to make sense of theiranalysis efforts. Desktop Engineering asked Peery the followingquestions about visualization's role in manufacturing and process.
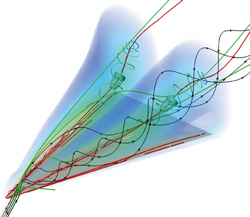
Tecplot is used here to view the vortical flow around the primary vortex of adelta wing at a 40-degree angle of attack.
DE: What are some challenges engineers face when trying to visualize their data?
Peery: The most common challenge is the need to accurately and quicklyanalyze large amounts of technical data. Often, however, engineersaren't able to find effective, intuitive, easy-to-use, and affordablevisualization software that can handle all their data analysis andsimulation needs. An effective visualization tool must let engineersgauge the quality or accuracy of their simulation results, ensure thattheir work has been done properly, interpret results, and plan forfuture investigations.
Another frequent challenge is the lack of a single, unified tool to doall of their data visualization from x,y plots to iso-surfaces, andfrom slices and contours to velocity arrows and streamtraces on 2D or3D data.
Other common challenges are the ability to automate redundant plotmaking, especially while simulations are running; the ability tocommunicate and prepare high-quality visual output for publication onthe Internet, in PowerPoint, or in technical papers; the ability tofind an affordable tool that offers robust visualization capabilities;and the ability to find a flexible tool that can arrange and createplots that look exactly the way they want or need.
DE: What are the main benefits ofhaving an effective visualization tool?
Peery: The primary reason engineers, scientists, and researchers employvisualization technology is to accurately interpret their data. It'sthe analysis of data through visualization that results in greaterinsight, understanding, and knowledge.
As the lifeblood of any organization, money is the resource that keepscompanies afloat, workers employed, and customers satisfied. Companiesdo everything they can, including making investments where necessary,to streamline operations…. The purchase and implementation ofvisualization software is one such investment. Perhaps the main reasoncompanies choose to invest in visualization software is because it canincrease the productivity of its technical professionals. When theirproductivity increases, they generate quality results in less time,resulting in greater efficiencies that directly impact the bottom line.
And best of all, the return on investment (ROI) benefits of usingvisualization software can be measured in weeks or months, not years.While other enterprise-wide, or even department-wide, software requiresyears to fully benefit an organization, visualization software bearsfruit much sooner. Users can be up and running in a matter of days, andgenerate meaningful results in weeks, depending on the size andcomplexity of their data.
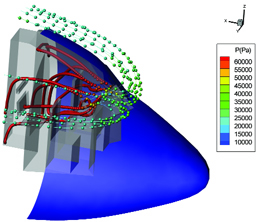
Suddendecompression inside a cockpit visualized with Tecplot. Using theseresults, engineers can better design cockpit doors and windows.
DE: What are the top features engineersgenerally want in visualization software?
Peery: Ease-of-use, speed, robust functionality, and rock-solidstability. A visualization tool lacking any of these four ingredientsis likely to hinder productivity, rather than enhance it.
I hear from chief engineers all the time about their challenges, andonce they lock on to a solution they are comfortable with,overwhelmingly they tell me the reasons they like working with ourvisualization software are: it's easy to use right out of the box andit's fast.
DE: How important is visualization tothe numerical simulation process?
Peery: Whether measuring the stress levels of an airplane wing orrecording temperature fluctuations in a NASCAR engine, numericalsimulation is the engineering technique of choice for many technicalprofessionals. Numerical simulation alone, however, is not enough. Thedata generated by the simulation must still be analyzed and, oftentimes, presented to others. That's the critical job of visualizationsoftware.
The result of CFD simulation, for example, is a set of numbers that hasno physical meaning until it's visualized in graphs, images, andanimations. For visualization software to be effective, it must provideadvanced technical plotting tools that help visualize simulationresults in a convenient and efficient way. It must allow the user toconcentrate on his numerical model, not the visual output.
There are times, in fact, when visualization software is so importantthat it can make the difference between a project surviving or dying.One of our customers has told me that his team is working on a two-yearfeasibility study in nanotechnology. When the two years are up, hesays, there are only two ways to make sure funding for the studycontinues: perform flawlessly and communicate effectively. While theirexperiments must be insightful and comprehensive, he says thepresentations to their customer must be compelling and convincing, andthat's where Tecplot comes in. It's being used extensively in each ofthese areas, so they consider it an invaluable tool. And the studygroup is counting on it to deliver huge benefits.
DE: Is price a major consideration when selecting an everyday visualization tool?
Peery: Even engineers in the biggest companies or best-fundedgovernment agencies must work within a budget, so price is definitely amajor consideration. Managers and engineers everywhere are looking todo more with less; to increase productivity while keeping down costs.Effective visualization software is key to meeting these objectivesbecause of the rapid ROI it delivers. If the software is too expensive,however, it exacerbates the problem it was purchased to solve.
We've been ableto offer Tecplot at a good price. It's relativelyinexpensive compared to other CFD visualization tools. Because of this,the Army Corps of Engineers, an organization funded with taxpayerdollars, is a customer.
DE: What do engineers typicallydo with data visualization software?
Peery: They generate all kinds of graphical output to try to make senseof complex technical data; x,y plots, polar surfaces, 2D and 3D graphs,and animations are among the visuals commonly used to explore,manipulate, and interactively view data.
Engineers also automate routine data analysesand graphing operationswith macros, templates, layouts, batch mode, stylesheets, and customadd-ons. Finally, they output high-quality images and animations forpublication, either on the Internet, in PowerPoint presentations, andin technical papers. It is through the communication of their resultswith others that validates the work of engineers and transfersknowledge.
DE: Are there any all-in-one product that can meet all of an engineer's visualizationneeds and requirements?
Peery: While few and far between, there are a few all-in-one productson the market, each offering the most versatile, efficient way toanalyze and present numerical simulation results. These comprehensivetools let engineers quickly and easily create the exact plots andanimations they want with a single piece of software. They also offertrue multiplatform compatibility and support for most common data fileformats.
Our research has shown that most users, because of learning curves andbudget considerations, don't want a single-purpose software package.They want a versatile visualization tool that works tremendously wellas a CFD postprocessor, for example, but one that can also work wellwith more basic line plots and 2D data sets.
DE: Is it possible toautomate the visualization process?
Peery: Yes. Using tools like macros, templates, layouts, batch mode,stylesheets, and custom add-ons, engineers can automate the entireprocess, assuming they've purchased visualization software that offersthese capabilities.
DE: What is typically the endresult of visually analyzing one's data?
Peery: Often overlooked in discussions about visualization software isthe output it generates, usually a plot or animation that is presentedto colleagues and customers. Most visualization software can generatefantastic onscreen images that help users perform detailed analysis oftheir data, but does it offer versatile output formats that protectresolution and graphics quality? Because sharing results is often asimportant as getting them in the first place, presentation output is anintegral component of visualization software.
DE: Is technical support important to engineers using visualization software?
Peery: Just ask any engineer who's been on deadline and experienced atechnical problem and you'll hear a resounding, "absolutely!" In fact,many users consider technical support as one of the top three productfeatures that must be evaluated prior to purchasing visualizationsoftware. After ease-of-use, our user base commonly cites excellenttechnical support as a major strength of our product and a keydifferentiator between Tecplot and the competition.While no user wants to seekout technical assistance on a regularbasis, it's helpful to have a knowledgeable person on the other end ofthe phone who is truly interested in solving your problems.
Editor's Note: Read Keith Crowe's review of Tecplot Version 10 in the March 2005 edition of Elementsof Analysis.
Company Information
Tecplot Inc.
Bellevue, WA
tecplot.com

DE's editors contribute news and new product announcements to Digital Engineering. Press releases may be sent to them via [email protected].
Follow DEJoin over 90,000 engineering professionals who get fresh engineering news as soon as it is published.


About Us · Contact Us · Editorial Team · Advertising · Privacy Policy · Subscriber Services · © 2026 Digital Engineering 24/7 · Peerless Media