Clean Printing Through CFD
CFD saved Xerox Corporationthree years of development time onthedesign of a contamination controlsystem for a new printing press.


Latest News
January 1, 2005
By Francesco Zirilli
When Xerox Corporation started the development and design of a newhigh-speed color printing press, concerns centered around new emissionsspecifications set by Xerox itself and more established ones created bythe federal Occupational Safety and Health Administration (OSHA).These emissions, which include ozone (O3), particulates, and VOCs(volatile organic compounds), are the byproducts of the xerographicprocess in modern printing. A new contamination control system had tobe developed to ensure that the printer met the established criteria aswell as Xerox’s own reliability targets.

Figure 1: Particle contaminant trajectories were mapped within thecyclone separators, the collection bottle, and the final filter withthe filter being modeled using Fluent’s porous media capability.
The Ozone Challenge
In a full-color process, ozone generation occurs at a higher rate thanin its monochrome counterpart. Ozone is a highly reactive gas formedwhen air is ionized. In the xerographic process this takes place as thephotoconductive surface is uniformly charged by the corona dischargewhen a high voltage is applied to a thin wire before creating the image.
Though ozone has a short half life, typically half an hour, in thattime span it can wreak havoc inside and outside the printer. Aside fromcausing eye and throat irritations, ozone’s reactive nature means itcan deteriorate and damage printer components, causing a reliabilityproblem. As a result, ozone needs to be collected at the source andconverted back to oxygen using a chemical reaction.
Another part of the contamination control system had to be designed tocontrol airborne toner within the printer because its accumulation onprinter components typically creates an additional dependabilityproblem. Toner had to be collected, transported, and separated from themain air stream. Finally, the air must get filtered and reconditionedin another system before being returned to the printer or the customerenvironment.
Engineers at Xerox estimated that based on experience with otherless-complicated contamination control systems, it would have takenapproximately five years to meet design specifications for the newmachine using the traditional build-and-test method. Since theirgreatest challenge was to determine required air flow rates to eachcomponent and three separate filtering subsystems—accurately balancingthe flow through 29 branches of the air distribution system—engineersdecided to use Fluent CFD (computational fluid dynamics) software from FluentIncorporated (Lebanon, NH) to model the whole process. The entire distribution systemwould be simulated to evaluate the performance of the initial designand to try new concepts and ideas by modifying the numerical modelbefore building any prototypes.
Figure 2: The first step was the separate modeling of each of the threesubsystems. CAD files were imported in IGES format into Gambit,Fluent’s preprocessor, to generate the geometric model.

Sophisticated Contamination Control
The design of the high-end printer’s contamination control system isunderstandably sophisticated. It includes an ozone collectionsubsystem, an emissions control subsystem, and an environmental controlsubsystem. The latter system consists of an air conditioning unit toprovide stable temperature and humidity levels to the electronic andmechanical subsystems enclosed in the printer body with a secondaryfunction of cooling the developer units. The ozone control subsystemcollects the ozone and other corona discharge byproducts and passesthem through a catalyst, which converts the ozone back into oxygenbefore it returns to the environmental control unit for reconditioning.Finally, the emissions control subsystem collects airborne tonerparticles at each developer station, separates the particles from theair stream using multiple cyclone separator units, and returns the airto the environmental control subsystem.
Each component in the contamination control system requires apredetermined flow rate for proper function. The main driver is ablower, but there are also seven additional blowers for individualcomponents. The closed-loop system means all the air used needs toreturn to the environmental control system, so accuracy in determiningrestrictor sizes, restrictor locations through the flow path, andoverall pressure drop for blower size requirements was paramount. Thetraditional approach in addressing these issues is to wait until aprototype is constructed and perform physical measurements. But, asstated earlier, repeating this build-and-test cycle until thesesophisticated design specifications were met would have been extremelycostly in terms of time and money.
Many design iterations would be required because physical testing wouldprovide little or no useful information about the details of the flow.Without understanding these flows, engineers often have to rely uponintuition and estimates in making design changes.
Simulation Provides More Detailed Info
For these reasons, Xerox engineers picked Fluent. The program not onlyprovides fluid velocity, temperature, and other relevant variables asit analyzes problems with complex geometries and boundary conditions,but it has a graphical user interface that greatly reduces the time andtraining required to set up analyses. Another benefit is that a usercan change the system geometry or the boundary conditions and view itseffect on any of the variables.
The first step in setting up this simulation was the separate modelingof each of the three subsystems. CAD files were imported in IGES formatinto Gambit, Fluent’s preprocessor, to generate the geometric model.The geometry (see Figure 2, above) was cleaned up using the toolsavailable in Gambit, after which a hybrid mesh (involving multipleelement shapes) was generated.
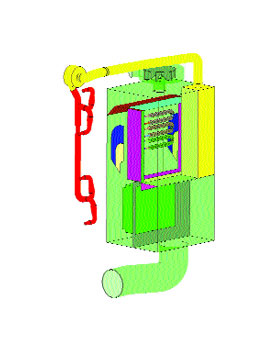
Figure 3: This geometric model shows the details of the filter media,the evaporator unit, and the main blower. The physical parametersgoverning the pressure drop of the porous media were determinedexperimentally.
Fluent 6.0 was then used to compute the pressure and velocity fields.Initial results obtained using the k-e turbulence model were refinedwith the RNG k-e model. This provided a much more accurate solution forthe flow inside the cyclone separators. To accurately predict the totalflow through the system, the main blower unit (existing blowers wereused) was modeled in detail using the multiple reference frames (MRF)model available in Fluent. With this model, a rotating frame is usedfor the impeller while a stationary frame is used for the blowerhousing. The solution proceeds with a steady transfer of informationacross a predefined interface between the two frames. The other sevenblowers were modeled by measuring their flow characteristics in thelaboratory and entering the “fan curves” into the CFD model.
In an example of Fluent’s solution (see Figure 1, above) particletrajectories were mapped within the cyclone separators, the collectionbottle, and the final filter. The filter was modeled using Fluent’sporous media capability, which is modeled as a fluid with highresistance. As a result, particles are allowed to be transportedthrough the media, the parameters of which were first determinedexperimentally.
In another example, the environmental control unit was modeled todetermine the operating pressure drop and flow uniformity into theevaporator unit. Flow returning from the print engine passes through ahigh-efficiency particulate air filter before entering the evaporatorunit. Air is cooled to remove moisture, and reheated to the desiredoperating temperature. The geometric model (see Figure 3 above)shows the details of the filter media, the evaporator unit, and themain blower. The physical parameters governing the pressure drop of theporous media were determined experimentally.
Based on the CFD results, the flow distribution in the initial conceptdesigns of the individual systems was found to vary by up to 100percent from the required levels.
Modifying Subsystem Models
Each of the models was validated by comparing its predictions to anearly prototype. Once the models were validated, Xerox engineersmodified pipe and restrictor diameters as well as manifold shapes toobtain the correct flow distribution.
In this process, they were aided by the voluminous data provided in thesimulation results that made it possible for them to visualize the flowthrough the entire subsystem, in most cases making it relatively easyto determine what areas needed to be changed. The ozone subsystemproved to be the most complex, with 15 iterations required to bring itinto compliance with specifications.
After they had optimized each of the individual models, the engineerscombined them into a full system model in order to captureinterdependencies among the different subsystems. Since the full systemoperates as a closed loop, no boundary conditions were required. Butadditional design iterations were required in order to bring the entiresystem back into compliance. Once this was accomplished, engineerschanged the model assumptions to simulate operation at differentaltitudes, ensuring that the system would continue to operateeffectively in different geographic regions around the world.
Static pressures at preselected locations agreed with numericalpredictions within 11 percent and flow rates through each subsystemagreed with experimental results within 15 percent. When the firstprototype was built, flow rates ranged from 0 percent to 5 percent oftargets, well within design specifications. Engineers used Fluent’sparallel processing capability, which takes advantage of workstationswith multiple processors to reduce computational time. It speeds theprocess to a degree that is almost linear with the number of processorsavailable. For this simulation, engineers used a Sun Ultra 60dual-processor workstation, which solved the full system model in about36 hours. The result was that the design was completed in only twoyears, which reduced engineering costs and assisted in bringing theproduct to market faster.
This application demonstrates the many advantages of CFD compared tothe traditional build-and-test method. First, engineers can try newconcepts and ideas by modifying the numerical model before anyprototypes are built. Second, they can use the model to troubleshootproblems that arise in the actual machine. Third, CFD provides a morecomprehensive picture of the operation of the entire system. In thiscase, these advantages provided a 60 percent reduction in productdevelopment lead time while enabling engineers to evaluate many moredesign alternatives.
Francesco Zirilli, Ph.D. is the principal engineer at XeroxCorporation. You can contact him about this article via e-mail at[email protected].
Companies Mentioned
Fluent Inc.
Lebanon, NH
website
Xerox Corp.
Stamford, CT
website
Subscribe to our FREE magazine, FREE email newsletters or both!
Latest News
About the Author
DE’s editors contribute news and new product announcements to Digital Engineering.
Press releases may be sent to them via [email protected].


