

Latest News
June 1, 2004
By Ramesh Ramalingam

Although many design engineers today routinely perform linear stress, dynamic,and thermal analyses, they may be intimidated by nonlinear analysis and unsureabout why, when, and how to use such a tool. Engineers need to understand sometheory if they want to perform nonlinear analyses with confidence, and they needhands-on experience,even just training class, to be able to use it properly.
This article looks at how to recognize nonlinear behaviors, and define what theyare. The software solutions discussed come from COSMOSDesignSTAR from SRAC, andaccount for general-purpose nonlinear analysis.
While most engineering problems contain nonlinear effects, linear analysis resultsoften provide sufficient information. However, linear static analysis assumesinduced displacements will be small, changes in structural stiffness caused byloading will be negligible, and no change will occur to the magnitude and directionof the load while the structure deforms. Thus, it assumes a linear relationshipbetween the loads and the induced response. For example, it assumes that doublingthe load doubles the response of the model (displacements, strains, and stresses).
In addition, linear analysis is generally more conservative than nonlinear analysis.The results it provides may cause over-design, which always results in additionalweight. Not only is this undesirable in weight-critical application, such as spaceexploration programs, but it can be costly. Companies can realize significantsavings with even slight material reduction in mass-produced products. Nonlinearanalysis works better in such cases, as well as in situations where linear analysisfails to model real-life behavior.
For instance, take a common steel paper clip. Its design requires it to be elastic,i.e.,it should go back to its original shape when removed from the sheets of paperit holds. However, if you use the clip for holding too many sheets, the sideswill not go back to the original shape, meaning that the clip has undergone permanentdeformation. Nonlinear analysis provides the information needed to verify thedesign will have no permanent deformation.
The pop-top of an aluminum beverage can offers another example. The user hasto cause permanent deformation to break open the top to access the beverage. Herethe design intent is to make it easy to open the top while avoiding accidents,such as if the user inadvertently presses the tab. Nonlinear analysis will helpmake sure that the pop-top works effectively.
Nonlinear analysis users will encounter several different kinds of nonlinearities:material, geometric, and boundary (contact).
Material Nonlinearity Most engineers understand that plastics and rubber materials have nonlinear stress-strainbehavior. But less well-known is that, when subjected to high loads, metals suchas steel and aluminum exhibit nonlinear behavior. Up to their yield point, metalsshow a linear stress-strain relationship; i.e., induced displacement is linearlyproportional to the applied loads, and upon removal of the load, the model goesback to its original shape.|
|
|
Figure 1: Stress-strain curve for annealed low carbon (0.18% C) steel. Source:Atlas of Stress-Strain Curves, Second Edition, ASM International, 2002, page 71. | Figure 2: Stress-strain curve at room temperature for 316 annealed stainlesssteel bar (UNS S31600). Source: Atlas of Stress-Strain Curves, Second Edition,ASM International, 2002, page 198. |


Figures 1 and 2 (above) show the stress-strain curve of two different steels.Low carbon steels (Figure 1) have an upper and lower yield point. Typically, materialhandbooks report yield strength as the lower yield point. Certain metals, suchas the 316 stainless steel (Figure 2), have no distinct yield point. To analyzesuch materials, use proof stress at 0.1 or 0.2% strain (as yield value). Beyondthe yield point, however, that relationship becomes nonlinear. After loading andunloading, the model may not go back to its original shape. Thus, it exhibitsplastic rather than elastic behavior; i.e., upon unloading, the model recoversonly the elastic portion of strains and some permanent deformation remains.
To identify material nonlinearity, first the user runs a linear analysis to learnthe maximum stress. If the maximum stress of ductile materials exceeds the yieldstrength of the material, or if it is greater than 90% of the yield strength,the engineer should perform nonlinear analysis to capture the plastic deformationof the model. For plastics, the linear portion of the curve is so small that theycan be considered nonlinear materials. That is, plastics should always requirenonlinear analysis. Rubbers always have nonlinear elastic behavior and thereforealways require nonlinear analysis.
Material nonlinearities also occur when the stress-strain relation depends onduration of loading (as in creep analysis) and temperature (as in thermoplasticity).
Geometric NonlinearityGeometric nonlinearities occur in models with large displacements or rotations,large strain, or a combination of those.
The most common geometric nonlinearity is large displacement. To detect this,first perform linear static analysis and plot the deformed shape with a scalefactor of 1. As a rule of thumb, if the deformed shape appears different fromthe original shape, it requires nonlinear analysis with large displacement. Nodistinct limit identifies large displacement, but some assumptions may be made.For example, in a cantilever beam, if the displacement is more than 2% of thelength, or more than 20% of the short span length, it’s safe to assume large displacement.
|
|
Figure 3: Stress distribution in a hose clip calculated using linear analysis.In this case, the hose clip did not rotate completely to form a circular ring.The original shape of the hose clip is shown in gray. |

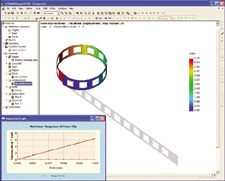 |
Figure 4: Stress distribution in a hose clip calculated with geometric nonlinearanalysis. The original shape of the hose clip is shown in gray. The inset showshow the clip was rotated by applying force in small increments. |
Some large displacement problems, such as a pressure vessel, make it necessaryto consider change in the direction of the load. When subjected to very high pressure,the vessel undergoes a drastic change of shape. The pressure load always actsnormal to the walls of the pressure vessel. Linear analysis of this scenario assumesthat the shape of the vessel does not change, which is incorrect. Realistic analysisof the pressure vessel requires analyzing geometric nonlinearity with non-conservative(or follower) loading.
Strain, which is the ratio of change in length to the original length of themodel, also causes geometric nonlinearity. For example, if a 10-inch long barstretches to 10.1 inches because of tensile load, then strain in the bar equals0.1/10 = 0.01 (or 1% strain). If the strain in a model is greater than 5%, thenanalysis of geometric nonlinearity with the large strain option is necessary.
Metal forming processes, such as deep drawing and rolling, as well as parts madeof rubber-like materials, are normally associated with large strain. All largestrain problems are also large displacement problems. To find out if it is necessaryto consider the large strain option, look at the strain results from nonlinearanalysis with large displacement and small strain. If the strain exceeds 5%, thenit is necessary to include the large strain option. Material models for rubber-likematerials consider large strain by default.
Boundary NonlinearityBoundary nonlinearities occur when applied loads change a structure’s boundaryconditions; e.g., contact problems like gear-teeth. In such problems, no linearrelationship exists between the applied load and the resulting contact area/contactforce, even if the material behavior is in the elastic range with small displacementand strain. Also, no linear relationship exists between the applied force andthe induced displacement, which changes dramatically once the contact occurs becauseof the applied loads.
Using Linear Analysis InputLinear analysis results can tell the user whether nonlinear analysis is necessary.An engineer needs to determine:
, Is maximum stress in a model with ductile materials within 10% of the yieldvalue?
, Does a plot of the deformed shape with a scale factor of 1 appear differentfrom the original shape?
, Does the load direction change with geometry changes?
, Does the strain value go beyond 3% to 5%?
, Is the deformed shape of the model different from what you expected?
“Yes” answers indicate the need for nonlinear analysis. Whether to perform nonlinearanalysis or not may also depend on the failure criteria, which may differ by companyand by component.
An engineer using COSMOSDesignSTAR can drag-and-drop the loads, constraints,mesh, and material from the linear study to a nonlinear one. To perform a largedisplacement problem, the user has to associate all the loads with a curve sothat application of the total load occurs in small steps and so that the stiffnessof the model is updated at each step.
For material nonlinearity problems, the user needs to define the material model,getting the required material properties from a material handbook or the materialmanufacturer. When obtaining material properties, make sure to check the testingtemperature and strain rate of the material data with that of the operating conditionsof the model. To find out permanent deformation and residual stress, the userneeds to define a time curve such that the load increases from zero to maximumload and then back to zero.
It’s important to remember that a nonlinear analysis always will take longerto run than a linear analysis,regardless of technical advances,because it runsas many analyses as the number of time steps chosen. However, as solution timescome down for linear analysis, the same will be true for nonlinear analysis. Engineerswith access to an easy-to-use interface such as that of COSMOSDesignSTAR willfind it possible to run nonlinear analyses for their everyday problems.
Ramesh Ramalingam is the product manager for COSMOS. You can contact him through e-mail, c/o [email protected] .
Mentioned in the ArticleSubscribe to our FREE magazine, FREE email newsletters or both!
Latest News
About the Author
DE’s editors contribute news and new product announcements to Digital Engineering.
Press releases may be sent to them via [email protected].


