Helping design and engineering professionals discover, evaluate and specify technologies and processes that shorten the design cycle and enable success.

May 2026 Special Focus: Artificial Intelligence in Design and Simulation
In this Special Focus Issue, learn about the latest developments in the integration of artificial intelligence into engineering workflows.

Design & Simulation Software Guide 2025
In this Special Issue, Digital Engineering presents its second annual guide to design and simulation software vendors.
Former world champion (2005-2006) Fernando Alonso of Spain won the 2010 Singapore Grand Prix, beating his German Formula One title challenger, Sebastian Vettel, in a tense, hard-fought finish. The margin of victory for Alonso’s Ferrari—supported by a racing staff of 800, a budget approaching $400 million, and some of the world’s most sophisticated engineers and technologies—was just two-tenths of a second.
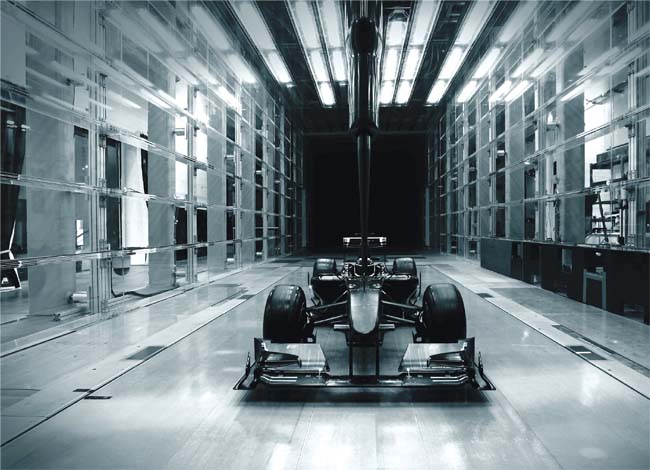 At Toyota Motorsport in Cologne, Germany, engineers use wind tunnels with sophisticated built-in PIV systems to help design faster high-performance cars. |
The stakes in top-level automobile racing are enormous: careers, sponsorships, corporate reputations, products and untold millions in various forms of revenue are on the line for both the racing teams and the carmakers. Teams in Formula One—the most technically advanced form of racing in the world—devote nine-figure annual budgets in the search for that little bit of edge that might yield just tenths or hundredths of a second on the racetrack.
Aerodynamics is one of the most important areas that teams and manufacturers look at in their search for such improvements. They rely on some of the world’s top computational fluid dynamics (CFD) and particle image velocimetry (PIV) engineers to find those tiny fractions of a second.
Frank Michaux, a CFD/PIV researcher at Toyota Motorsport in Cologne, Germany, is one of those engineers. Carmakers and racing teams from around the globe come to Cologne to tap his expertise and take advantage of the latest cutting-edge technology offered at the Toyota Motorsport facility.
“Many of today’s street cars use technology drawn from racing cars,” said Michaux. “If researchers can identify a way to reduce drag on a racing car, it’s reasonable to assume that this information also may apply to future versions of a normal road car.”
That is particularly true in the field of aerodynamics, since U.S. regulations require a manufacturer’s collective fleet of vehicles to achieve a certain level of fuel economy known as corporate average fuel economy (CAFE). One way to achieve those goals is through improved aerodynamics—hence, the line of customers at the door of a facility like Toyota Motorsport.
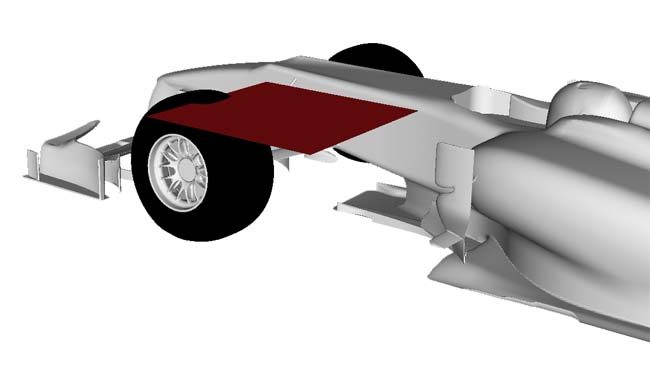
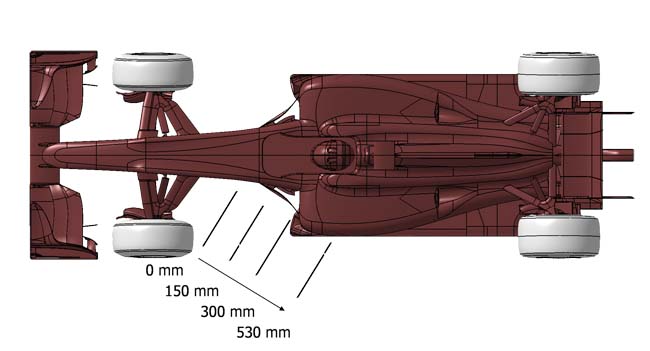 During the 2009 Formula One season, engineers wanted to study the wake behind the front wheels of a vehicle—a critical part of the flow that can affect the performance of the entire vehicle. |
Michaux and his team use a number of advanced analysis techniques to find performance gains in all kinds of vehicles, from NASCAR, Formula One and prototype sports cars to finely built street models. Michaux’s team at Toyota Motorsport maintains two state-of-the-art automotive wind tunnels, each fully equipped with its own built-in PIV system. To get the results that his clients demand, Michaux’s team uses Tecplot visualization software to analyze the data gleaned from wind tunnel testing.
The Need for Speed
Development in auto racing is a never-ending process. With cars developed to the stratospheric level of modern Formula One cars, the advances are miniscule, but still significant. Each change can affect airflow, downforce or drag, which in turn affects the car’s top speed, cornering capability and mileage. The pace of development is critical: One week of lag time in development means a team has fallen behind its competitors, according to Michaux.
“At Toyota Motorsport, we need to deliver data quickly. If you see that you are not capturing the flow correctly, then you need to adjust your CFD methodology until you get it right,” he adds. “The sooner and faster you can do that, the better.”
PIV’s Role
PIV is an optical method of flow visualization that has been used since the 1980s to obtain instantaneous velocity measurements and related properties in fluids. But it wasn’t until very recently that it became a practical design tool for engineers, largely thanks to the increasing power and decreasing cost of both computers and high-speed digital cameras.
PIV allows for the visualization of the flow field almost exactly as it appears in the wind tunnel, without influencing the flow field that engineers are seeking to measure. The PIV system at the Toyota Motorsport facility involves filling the wind tunnel with a fog or mist with essentially the same density as air. When the air flows through the tunnel, the small particles that make up the fog simply float, making it as non-intrusive as current technology will allow.
For the PIV test, engineers position a camera at a 90° angle to the plane of the flow field they want to study. The wind tunnel is then filled with the fog, and the lights are extinguished.
 During a PIV test, Toyota Motorsport engineers fill the wind tunnel with a fog or mist, turn off the lighting, and shoot a high-powered laser at the model to illuminate the flow field, creating a 2D plane. At the same time, a camera, placed at a 90° angle to the plane, captures the image. The process is repeated at very small intervals (10 to 20 microseconds), allowing the engineers to compare the pictures and measure the direction and speed of the flow field. |
Next, the engineers illuminate the area they want to study with a high-powered laser, creating a 2D plane, and then shoot a series of two-set photos at extremely rapid intervals—generally 10 to 20 microseconds. Equipped with this sort of ultra-slow-motion digital imaging, they can easily measure the rate and direction of the flow.
Prior to the practical availability of PIV, engineers would create a simple vehicle model and study the flow on the surface of that model. This method was inefficient because they only saw the flow on the car’s surface, and didn’t have the means to produce a 2D plane or accurately observe and record the critical wake of the wheels. To compensate, they tried things like putting a smoke probe in the wind tunnel to “see” the air flow. But these techniques couldn’t accomplish what the engineers really needed: to fully and quickly capture accurate flow data.
“By looking at the smoke, we could visualize the flow, but we were unable to quantify it,” Michaux says. “You could only make assumptions about speeds based on the visual aspects of the flow. The challenge in this industry is how to visualize air flow without introducing something new into that flow that could potentially compromise the results. With the PIV method, you can really attach numbers to air flow.”
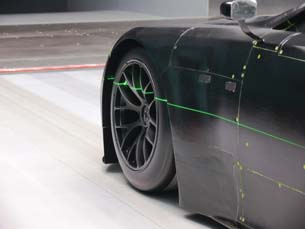 A laser is used to illuminate the flow field around the car’s front wheel to take PIV measurements at Toyota Motorsport. |
Combine CFD with PIV, and you’ve got a very powerful system for identifying what really can make a car go faster.
CFD/PIV Analysis with Tecplot Software
One example of how CFD/PIV analysis, supported by Tecplot’s visualization software, came into play during the 2009 Formula One season involved the study of the separation point, or wake, behind the front wheels. This is a critical part of the flow and has a material effect on the car’s performance. The Toyota Motorsport team experimented with various front-end parts, including an under-nose turning vane or modifying the front wing to create or influence an outwash. The goal was to push the flow out from under the nose of the car, forcing the wake of the car as far outboard as possible.
After gathering the raw data from the PIV measurements of the separation point on the front tires, engineers post-processed the data using Tecplot software that has been integrated with the PIV system. This allowed them to see and measure the exact position of separation. Each of Toyota’s PIV measurements consists of an average of 300 datasets, with each dataset containing two images taken 10 to 20 microseconds apart. The end result of the PIV process is a complete 2D field of vectors.
Engineers subsequently plotted the velocity magnitude, or vorticity, with vectors based on the average of all 300 datasets. The corresponding CFD results were then imported into Tecplot software, so engineers could compare the PIV and CFD datasets side-by-side to determine whether their CFD methods were within tolerances. Whenever necessary, the engineers tweaked the CFD process and reimported the results to Tecplot to get them closer to the wind tunnel PIV results.
In the case of the separation point on the front tires, initial tests showed that the separation point was late and too far back from the tires. The engineers altered the CFD methodology based on these observations, imported the new results into the Tecplot software and compared it with the PIV results to evaluate progress. This PIV technique was also applied to visualize the wake behind the front wheel. Several geometrical variations were measured and analyzed. The process was repeated until they arrived at a chassis and wing design that placed the complete wheel wake at an optimal position with respect to the car.
With speed and accuracy the name of the game, it’s essential for Toyota Motorsport to provide its automotive clients the data gathering, interpretation and visualization they need to stay competitive. They’re doing it successfully with the help of a state-of-the-art facility and support from Tecplot visualization software.
“We have the ability to accommodate a wide range of CFD and PIV requirements, and have a team of knowledgeable engineers available to assist with acquiring and visualizing the results,” Michaux concludes. “The tunnels and Tecplot play a significant role in helping us achieve that level of automotive science and service.”
More Info:
Tecplot

DE's editors contribute news and new product announcements to Digital Engineering. Press releases may be sent to them via [email protected].
Follow DEJoin over 90,000 engineering professionals who get fresh engineering news as soon as it is published.


About Us · Contact Us · Editorial Team · Advertising · Privacy Policy · Subscriber Services · © 2026 Digital Engineering 24/7 · Peerless Media