The Eyes’ Mind
Visualization in the Linux supercomputing era.


July 2, 2007
By Mike Long and Randall Frank
In 1999, the Gordon Bell Prize for achievement in high-performance computing (HPC) was awarded to researchers at the Lawrence Livermore National Laboratory, University of Minnesota, and IBM for a very high-resolution simulation of a shock turbulence model. At the time, it was the biggest data set ever generated — so big that it was impossible to visualize the polygonal surface of the model.
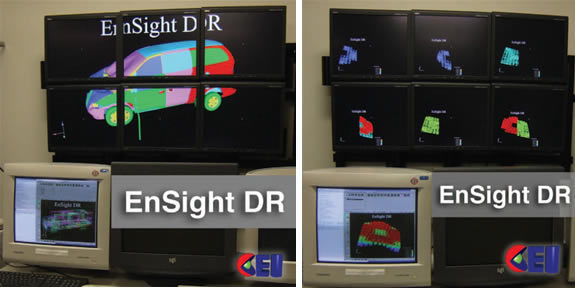 Small-scale data and displays:A simulated van crashing into a sign (left), and a picture of the individual sub-images of the 1999 Supercomputing data (right). Images courtesy of CEI |
In 2006, the same model was used to set a world visualization record for commercial applications by rendering at a rate of 1.5 billion polygons per second — three times the previous record. The mark was set while running Computational Engineering International’s EnSightDR on a Linux Networx Visualization Supersystem. It was achieved while processing a 589-million polygon model — the largest ever for EnSightDR.
Over the past seven years, changes in supercomputing and visualization have evolved to allow researchers to visualize extremely large data sets in their entirety. At the same time, the cost of the hardware and software that makes this possible has plummeted, thereby making visualization more affordable for use in traditional product design, and enabling national laboratories to push the boundaries of their research even further.
As the highway builders of the 20th century learned, wider roads lead to heavier traffic. Similarly, the ability to visualize enormous data sets quickly and cost effectively poses new and unique challenges to visualization users at varying levels of sophistication. First, changes in technology, from expensive, proprietary systems to more affordable, yet often more complex, Linux clusters continues to pose problems. This leads to a second challenge facing users at all levels of sophistication: how to handle large data sets optimally. Third and most intriguing, is a new problem relating to large-scale parametric studies and increasingly complex, higher dimensional data sets: with so much visualization horsepower, users can study a near-infinite number of conditions, but can that much information be conveyed to the user in a practical way?
The Evolution of Visualization
The availability and scale of supercomputing resources has progressed to the point where trans-terabyte-scale data sets have become common. As data set sizes escalated — users ranging from the largest national laboratories to traditional product designers — demanded more powerful and affordable visualization systems. Applications such as mesh visualization and CFD (computational fluid dynamics) are generating demand for visualization solutions targeting the aerospace and automotive industries as well.
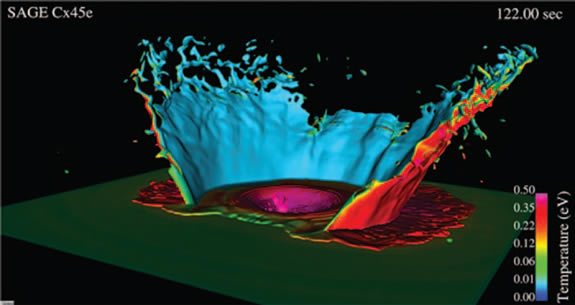 Visualization of a K-T impact. Image courtesy of Robert K.Greene, Los Alamos National Laboratory. |
The supercomputing visualization postprocessing market system was pioneered by makers of proprietary graphics systems in large-scale SMP (symmetric multiprocessing; that is, a single multiprocessor computer) systems. These systems were capable of rendering several million single-pipe polygons per second, but for many engineers they proved to be prohibitively expensive. At the same time, desktop workstation advances, driven largely by the desire for increasingly realistic rendering in games, resulted in desktop graphics processors that far surpassed the individual graphics pipe performance in these SMP systems. Users found they could handle more of the rendering problem on their desktop workstations, but moving data files from the computational system to the visualization system proved a logistical challenge, taxing local area networks. This often forced users to download and view only a subset of the data, making it difficult to gain insight from collective results.
This problem, in conjunction with continuing increases in absolute data set size, gave rise to the first visualization supercomputing clusters, capable of integrating visualization resources with supercomputing resources. This reduced costs but often forced researchers to become experts in integrating, validating, deploying, and tuning these components to obtain optimum visualization performance. The market is starting to address this problem with Linux supercomputing vendors beginning to develop fully integrated, application-tuned systems that reduce the management complexity posed by the first generation of clusters. Software vendors have responded with software specifically designed to support distributed rendering.
Distributed Rendering: Handling the Largest Data Sets
The analysis and visualization of large data sets is often driven by the need for increased spatial and temporal fidelity. This is true in a variety of fields, including aerospace development and meteorological studies. Even users in the commercial sector routinely do runs of hundreds of millions of cells. These data sets often exhibit two qualities: increased mesh size and dynamic range (a single simulation can have individual cells with three to four orders of magnitude difference in scale). The quest for higher-fidelity simulations can result in increasingly complex computational models as well, producing a multitude of higher-order output quantities. Despite advances in technology and the low cost of high-powered systems, such large runs can seriously strain both rendering and display resources, often beyond that of traditional desktop workstations.
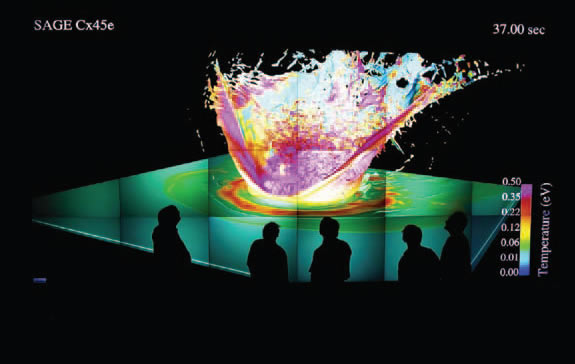 Images taken at the Los Alamos National Laboratory Metropolis Center’s PowerWall Theater, a 7680 x 4096 stereo display with seating for 85. Image courtesy of Los Alamos National Laboratory. |
Overcoming the challenges posed by large data sets requires application-tuned and optimized distributed rendering systems. High-performance distributed rendering is made possible by taking the balanced architecture of a clustered supercomputer and adding dedicated GPUs (graphical processing units) to a fast interconnect and a storage-enabled distributed memory system. Using dedicated GPUs, which can provide 180 to 360 million polygons per second per node, and linking them together with a dedicated, high-speed interconnect and distributed rendering-enabled software, enables users to render, in real-time, large-scale models that are too massive for any single system to handle.
Distributed rendering software is architected to read standard program output from a variety of applications and automatically decompose the model to smaller subsets then distribute the smaller subsets to hardware-enabled GPUs on visualization nodes. Each of the visualization nodes renders its subset of the model and then sends its rendering to a compositor. The compositor takes the rendered image of each subset and generates the complete image of the large-scale model. That image is then sent to one or more display screens. This process takes place 15 to 30 times per second for large models, allowing users to visualize deformation sequences, fluid flow separations, and shock surfaces ranging from millions to billions of cells.
While this addresses the fundamental problem of physically rendering a large data set, users still run into issues of how to display these complex, high-resolution images. Fortunately, distributed rendering also enables very high-resolution displays known as PowerWalls. For instance, imagine a model with elements that differ in size by several orders of magnitude.
Visualizing the necessary detail on each piece of the model in full context is impossible on desktop screens. One solution is a PowerWall, which can aggregate many desktop-scale displays into a single, seamless image. Typically, this image is projected onto a wall or other large surface from a collection of projectors, but it can take the form of a tiled array of display cubes (i.e., Clarity Visual Systems, now part of Planar Systems, Inc.), or even a simple collection of LCD panels. Realizing these types of displays requires coherently synchronizing and projecting images that have been rendered by numerous distinct graphic cards. Traditional visualization systems have had fixed technological limits on how large a PowerWall can be, be it number of pipes or number of pixels. With a fully distributed rendering system, those limits are eliminated.
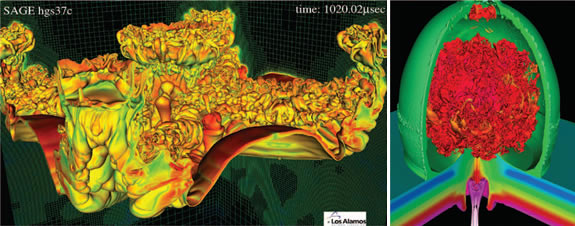 Images showing complex simulations.At left is an example of shock-induced mixing at an interface, and at right is a supersonic jet creating turbulent mixing. Images courtesy of Los Alamos National Laboratory. |
With these hardware systems in place along with capable visualization software, users can balance their rendering rate and display requirements. For example, in a virtual reality system, a premium is set on maximum frame rates. As a result, the systems need to have the highest performance interconnects, or they need to avoid the use of these interconnects for bulk data transfers during rendering. This can be done by balancing node memory sizes versus the data set decomposition and the number of tiers of image compositing used. Similarly, compositing systems can be tuned by node counts, composite tree layouts, and compression options to optimize for configurations such as remote desktop image delivery.
Systems based on commodity, such as Linux nodes, serve as a powerful platform for cost-effective system lifecycle enhancements that can further boost visualization performance. For instance, it is possible to double the performance of a distributed rendering system by doubling the number of GPUs on each node. While this causes certain cooling issues, the increased graphics density enables users who need it to maximize performance without eating up valuable rack space.
In addition, performance can be further increased depending upon the choice of network, and by adding local storage on each node. Fast networking is important for users who want to interact with models in near-real time. For example, researchers modeling a flow field want to see how that flow is evolving over time so that they can see where the streamlines go. Choice of network is critical for ensuring that those researchers get the frame rates necessary to visualize such models appropriately. Adding local storage, rather than relying on a central file system, can also speed up performance by avoiding the network entirely for many operations.
Dealing with Data Set Complexity
Distributed rendering has solved many of the problems arising from visualizing extremely large data sets, but it has, albeit indirectly, created a new problem. The more visualization power users have, the more they want to visualize. This leads them to increase the complexity of the data sets that they visualize, thereby leading to a data analysis problem.
Consider a multi-parameter study of a car crash. With added visualization capabilities and power, a car manufacturer can today run an analysis of not just crashing a car at different angles, speeds, and conditions, but also perform analysis on the results to connect that information to the cost of the crash as it relates to specific auto parts. With this information in hand, auto companies can take the expected step of redesigning the car for safety; however, they could also use this information to intelligently stock the supplies that a given model might require during its lifecycle.
Accomplishing an analysis of this magnitude requires a seemingly infinite number of runs to complete. There is no real limit to the amount of computational resources that can be consumed by a study such as this. The aggregate data set can keep growing exponentially as its computation is perfectly parallel. However, the visualization and analysis of this type of data requires a global, composite view of the entire data set. The question becomes, first, how do I compute the appropriate ensemble statistics, and second, how do I display the results in a way users can best understand them?
There is no easy answer. At least not yet. This problem is one of the next great challenges facing visualization users. It is further complicated by the fact that problems of this type are often domain-specific, so the tools must be customized for problem and industry.
One answer lies in the careful selection of hardware and software partners with the expertise in tuning systems for the purpose of solving specific problems. Gradually, these companies will begin to systematize, as much as possible, solutions to this type of analysis. Programmable visualization systems that push increasingly complex visual representation directly onto the GPU can be part of the solution and, when coupled with dynamic hardware and software configuration tools, are likely to form the basis for systems that prove capable of stepping up to this challenge. The use of mechanisms capable of rendering abstractions of data (i.e., distributions and statistical analyses) is one approach to addressing these issues. Other approaches include the use of Monte Carlo data analysis techniques and direct rendering of data “confidence” measures.
Further possibilities include the use of “topological” analysis of data as the foundation for access, as well as information extraction and representation.
Challenges Await
Visualization systems have proven to be capable of achieving rendering rates exceeding a billion polygons per second. Models made up of hundreds of millions of polygons are now capable of being processed, meaning that extremely large data sets can be visualized in their entirety. At the same time, the cost of hardware and software is declining, making this technology more affordable than ever before.
Yet for all the visualization horsepower available, problems still remain. The very rise of Linux supercomputers that spurred this growth has brought complexity in the selection, optimization, and deployment of systems. Likewise, while these systems deliver incredible power, obtaining optimum performance requires a careful approach and a well-designed architecture. The solution to both these problems is emerging with the rise of second-generation clusters, application-tuned and optimized, and delivered as production-ready systems.
However, the problems solved reveal problems lying in wait. Over the coming years, vendors and customers will have to tackle increasing data complexity. Perhaps in the next five years, the new visualization records will have more to do with the number of parameters being studied, and less to do with the actual size of the data.
Computational Engineering International—CEI
Apex, NC
ensight.com
Linux Networx, Inc.
Bluffdale, UT
linuxnetworx.com
Planar Systems, Inc.
Beaverton, OR
planar.com
Randall Frank is a senior developer at CEI, and Mike Long is a senior applications analyst at Linux Networx. Send your feedback about this article through e-mail c/o [email protected].
Subscribe to our FREE magazine, FREE email newsletters or both!
About the Author
DE’s editors contribute news and new product announcements to Digital Engineering.
Press releases may be sent to them via [email protected].


