

Latest News
September 1, 2012
By Mark Clarkson
Accurate, low-fidelity simulations are essential to the design of hypersonic vehicles, says Dr. Ryan Starkey, assistant professor and McAnally Faculty Fellow in aerospace engineering sciences at the University of Colorado, Boulder. High-fidelity simulations are just too computationally expensive.
The question is, says Starkey, “Can we do a better job of predictive design using a low-fidelity system? Can we pay a low-fidelity cost for a high-fidelity answer?”
Time and Expense
Above Mach 5, physical phenomena such as fluid flow or heat transfer act in non-linear ways. Worse, they are highly interdependent: Fluid flow affects heat transfer; heat transfer affects material properties, etc. Because you can no longer solve for these domains individually, every variable you add increases the number of solutions exponentially—and the analyses to produce those solutions can take a lot of time.
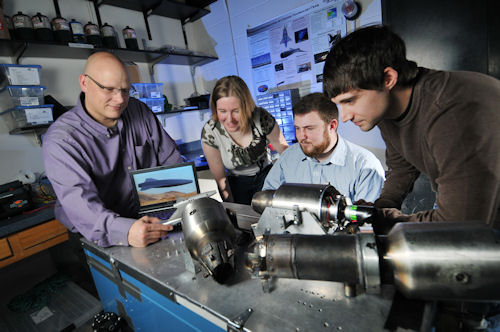 |
| CU-Boulder Assistant Professor Ryan Starkey, left, with some members of his team, looks over engine model nozzles for a first-of-its-kind supersonic unmanned aircraft vehicle. (Photo by Glenn Asakawa, University of Colorado.) |
While a low-fidelity analysis of a complex flow field might take just half a second on his computer, Starkey says, “If I do a high-fidelity model of that same geometry, it might take an expert to build a computational fluid mesh for it. With the time required to do the actual simulation, the whole process can take a month—and maybe more.”
That becomes untenable almost immediately. If you have, say, 100 interdependent variables to analyze over a range of conditions, it’s clearly an impossible situation. The goal, therefore, was to get as close as possible to the one-month answer for the half-second price. One of Starkey’s students, Kevin Basore, has been doing work on quantifying uncertainty in hypersonic vehicle design. The idea is to use the high-fidelity results to illuminate the shortcomings of low-fidelity models. What are those models getting wrong? What are they overlooking? How can they be tweaked and augmented to produce results closer to those of the high-fidelity analyses in much less time?
Quantifying Uncertainty
Starkey notes that Basore’s work “looked at whether we can quantify ]and reduce] the uncertainty in a low-fidelity model.
What uncertainty are we talking about, exactly? Practically everything. “There might be uncertainty in the atmospheric modeling,” says Starkey. “Maybe it’s not exactly what we’re going to see on the day of flight. There is uncertainty due to the physics of what we’re predicting. We’re trying to use reduced-order models, and we know that some of the physics are not modeled correctly. What’s the effect of that?”
There’s an inherent uncertainty in the equations the team uses to model chemical reactions, Starkey points out.
“We use reduced-order chemical reaction mechanisms; we might have 20 chemical reactions that mimic 200. That’s another source of uncertainty and error,” he adds. “What is the sensitivity of our final design to all of that uncertainty? Understanding that uncertainty helps us to do a better job of design.”
Surrogate Models
Basore’s low-fidelity models were primarily surrogate, or “black box,” models. The idea behind a surrogate model is to reproduce the results of a high-fidelity simulation—or the results of real-world testing—without the computational overhead.
Say you want to understand the motion of a simple pendulum. You could build a pendulum and measure its motion, or construct a virtual pendulum and run it through a dynamics simulation. But you can get a pretty good approximation of a pendulum’s motion using a (comparatively) simple differential equation. That equation is your surrogate model. It doesn’t reproduce all the work going on inside a high-fidelity dynamics simulation, but it gives approximately the same result.
That differential equation might not take into account air resistance, friction, wobbling in a third dimension and other niceties. Those are the kinds of uncertainties for which Basore would be seeking to quantify, reduce and compensate.
Diamond Airfoil Test Case
The first part of the project was a calibration study, a trial run for the methodology and the software. Because pendulums don’t figure prominently in hypersonic aircraft design, Basore chose a diamond, or double wedge, airfoil.
The lab ran both inviscid and viscous computational fluid dynamics (CFD) analyses for the airfoil. Inviscid analysis assumes an ideal fluid with no viscosity. It is, of course, not as accurate as viscid analysis, but it is computationally much simpler to solve. There is also a known, analytical inviscid solution for the diamond airfoil, so results could be checked against published results.
With both the inviscid and viscous analyses in hand, Basore had low- and high-fidelity predictions of the same flow field.
“We were looking to come up with a way to quantify the uncertainties,” says Starkey, “so we can take what we know to be uncertain about our system across a wide range of performance characteristics—Mach number, angle of attack, altitude, and so forth—and correlate that back to our low-fidelity predictive solution.”
Once the low-fidelity model was producing accurate results, Basore was ready to apply the same techniques to the more technically challenging problem of scramjet engine combustion.
The Scramjet Project
Scramjet combustion adds fast, complex chemical reactions to the equation. “The flow is passing through the engine in the millisecond time frame,” says Starkey. “Our understanding of the chemistry—of how we can inject, mix and burn fuel in that couple of milliseconds—is essential to the scramjet functioning.
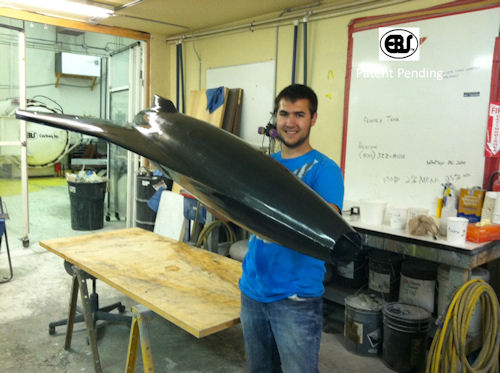 |
| GoJett Engineering Test Unit in Fabrication, held by Brandon Bosomworth, master’s degree graduate. (Photo by Edgar Flores, University of Colorado). |
“If we back off and do low-fidelity chemistry modeling, how does that do relative to high-fidelity modeling? Can we understand what uncertainties are in that low-fidelity system so we can correct them?” he asks. “If we have a conservative ]high-fidelity] method that always over-predicts something, can we have some basic understanding of that over-prediction and its magnitude? If so, then can we apply that same correction to low-fidelity code?”
Data Mining
All of this analysis produced lots of data. To organize and understand it, the team used Tecplot Chorus.
“Chorus became quite important in helping to sift through a lot of data very quickly,” says Starkey, adding that it is “a phenomenal resource for data mining. It made data mining—comparing the data, seeing what’s interesting in the data—very efficient.”
Chorus also allowed them to discover interesting results that they might not have predicted, or even thought to look for. Before, Starkey and Basore would have hunches of a couple of things they thought were going to be important to examine more closely, based on their prior experience.
“I’d write some scripts to pore through all my data and create images, and then try to figure out a way to visualize them all,” Starkey says. “It was a very laborious process.”
Because Chorus helps visualize the data, it helped Starkey and Basore understand the differences among all the cases—parsing the data down, both visually and numerically, to search through it.
“If I throw up all my simulations and I see one doesn’t look right, I can do a very simple visual comparison and see differences very quickly,” Starkey explains.
Chorus can display existing images created during the simulation, or create new images from either volume or surface data.
“I can start to dig through my bulk data set, very efficiently,” says Starkey. “I can say, ‘I want to see the differences. Using this one as the baseline, how are the rest of these different, numerically?’ Chorus will change the pictures to show me those differences. I can start to home in on the underlying physics that are causing that difference. Relative to the old way of doing things, Chorus is a phenomenal time-saver.”
And the end result of all this analysis? The project was a success, says Starkey: “For the cases that we ran, it worked out very well.”
Contributing Editor Mark Clarkson is DE’s expert in visualization, computer animation, and graphics. His newest book is Photoshop Elements by Example. Visit him on the web at MarkClarkson.com or send e-mail about this article to [email protected].
Subscribe to our FREE magazine, FREE email newsletters or both!
Latest News
About the Author
Mark ClarksonContributing Editor Mark Clarkson is Digital Engineering’s expert in visualization, computer animation, and graphics. His newest book is Photoshop Elements by Example. Visit him on the web at MarkClarkson.com or send e-mail about this article to [email protected].
Follow DE

