Helping design and engineering professionals discover, evaluate and specify technologies and processes that shorten the design cycle and enable success.


Digital Engineering April 2026
In the latest issue of Digital Engineering, we take a look at the latest innovations in design for additive manufacturing, including the use of natural language inputs, social media cosplayers, and AI integration. The issue also includes a feature…

January Special Focus Issue: Design for Additive
In this Special Focus Issue of Digital Engineering, learn about the latest advancements in design for additive manufacturing, including new software tools, additive in automotive, custom medical devices, and more.
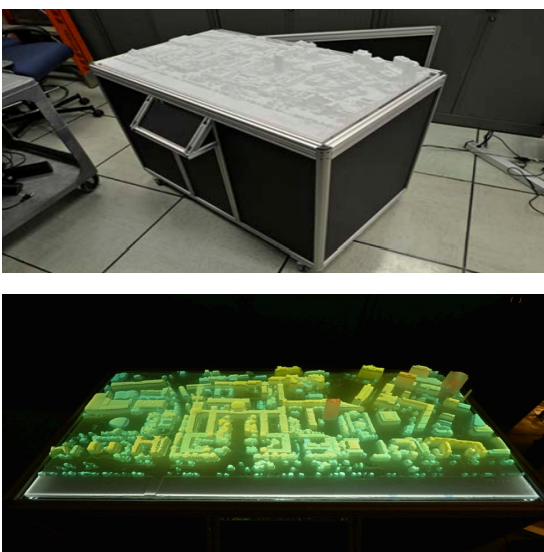 MIT's LuminoCity is a 3D printed plastic model of a campus that is illuminated as data is collected.
More powerful computers are making it easier and faster to process massive amounts of data, but actually making sense of big data is still a challenge. How can you effectively boil giant data sets down in a way to help users visualize what the results mean?
Researchers at MIT's Lincoln Laboratory have come up with one possibility: using 3D-printed models and projection to provide a concrete representation of big data.
Zachary Weber and Vijay Gadepally printed a 3D model of MIT's campus (dubbed LuminoCity) out of translucent plastic. A projector connected to a laptop illuminates the model, altering colors based on different data inputs.
The team filtered a portion of Twitter feed using the Twitter DecaHose tool looking for tweets that were geolocated on campus, and used the model to display the types of content created at different locations. Users could parse the data on an interactive screen.
According to the MIT Technology Review:
Weber and Gadepally say their approach is particularly useful when groups of people have to access the data at the same time. They give the example of city planners studying the patterns of traffic that occur in cities. That kind of data is difficult to reason about at a group level without a display that everyone can see and interact with. And the big advantage is that a key part of the data set, the model, is fixed—set in stone, almost. That allows complete flexibility with the data that needs to be crunched but complete inflexibility with the data that doesn’t need to be touched.
The 3D-printed approach could provide a lower cost alternative to expensive augmented reality systems that can provide similar displays.
MIT's Department of Civil and Environmental Engineering also used the model for its CLAIRITY project, a network of sensors built with 3D-printed housings that are used to measure levels of gases and particulates around the campus. Nodes on the model light up based on the sensor inputs.
You can read more about their research here.
Source: MIT Technology Review

Brian Albright is the editorial director of Digital Engineering.
Contact him at [email protected].
Join over 90,000 engineering professionals who get fresh engineering news as soon as it is published.


About Us · Contact Us · Editorial Team · Advertising · Privacy Policy · Subscriber Services · © 2026 Digital Engineering 24/7 · Peerless Media